- The negative sentiment is taking its toll as the S&P500 is dropping fast for the second consecutive day.
- The Index broke below the 2,900.00 handle as bears are eyeing the 2,850.00 support.
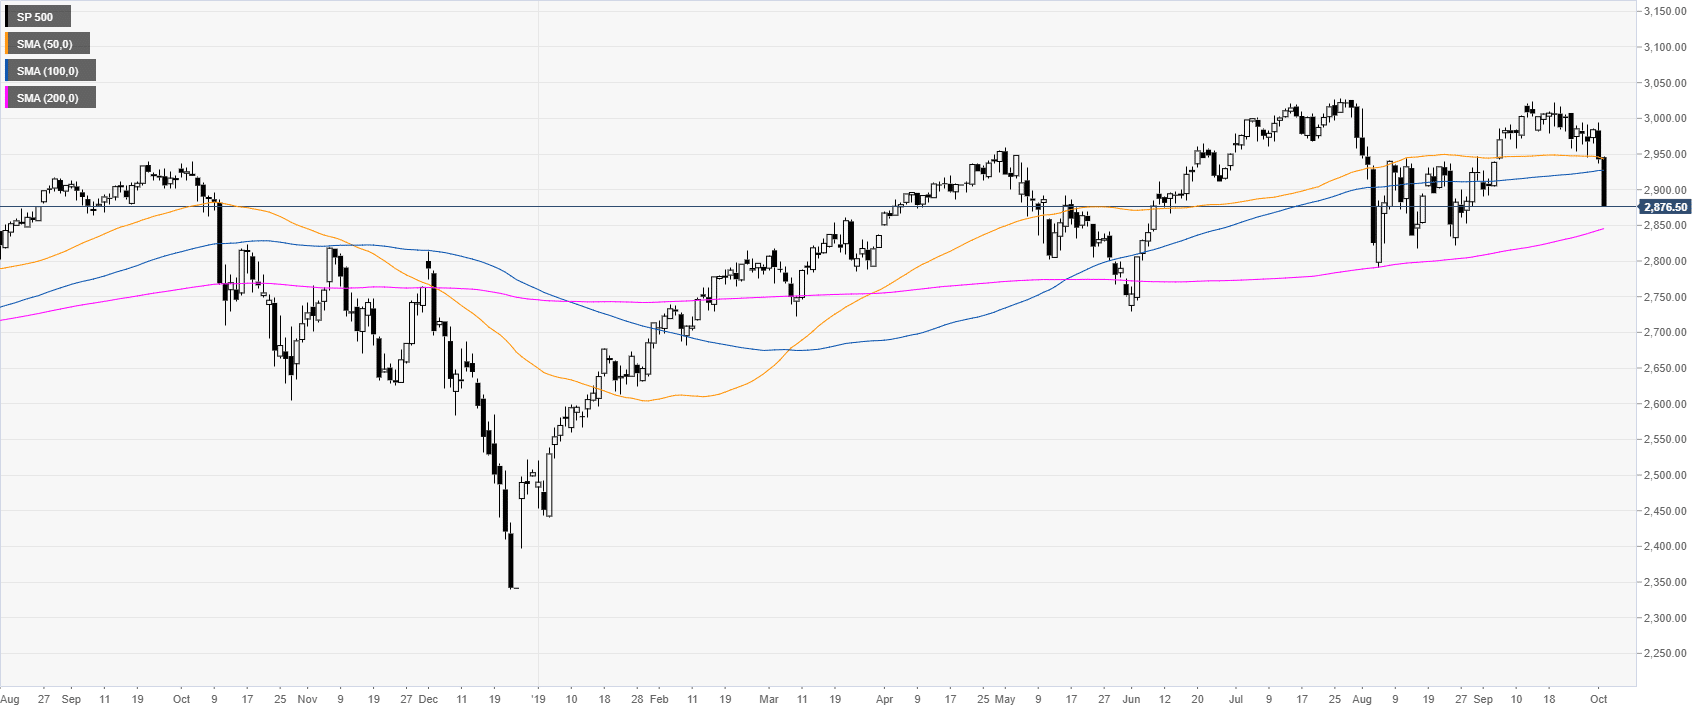
S&P500 daily chart
The Index is correcting down sharply below the 2,900.00 mark and the 50/100-day simple moving averages on the daily chart. The Institue for Supply Management’s (ISM) Purchasing Managers’ Index (PMI) data on Tuesday triggered fear of a recession in the United States.
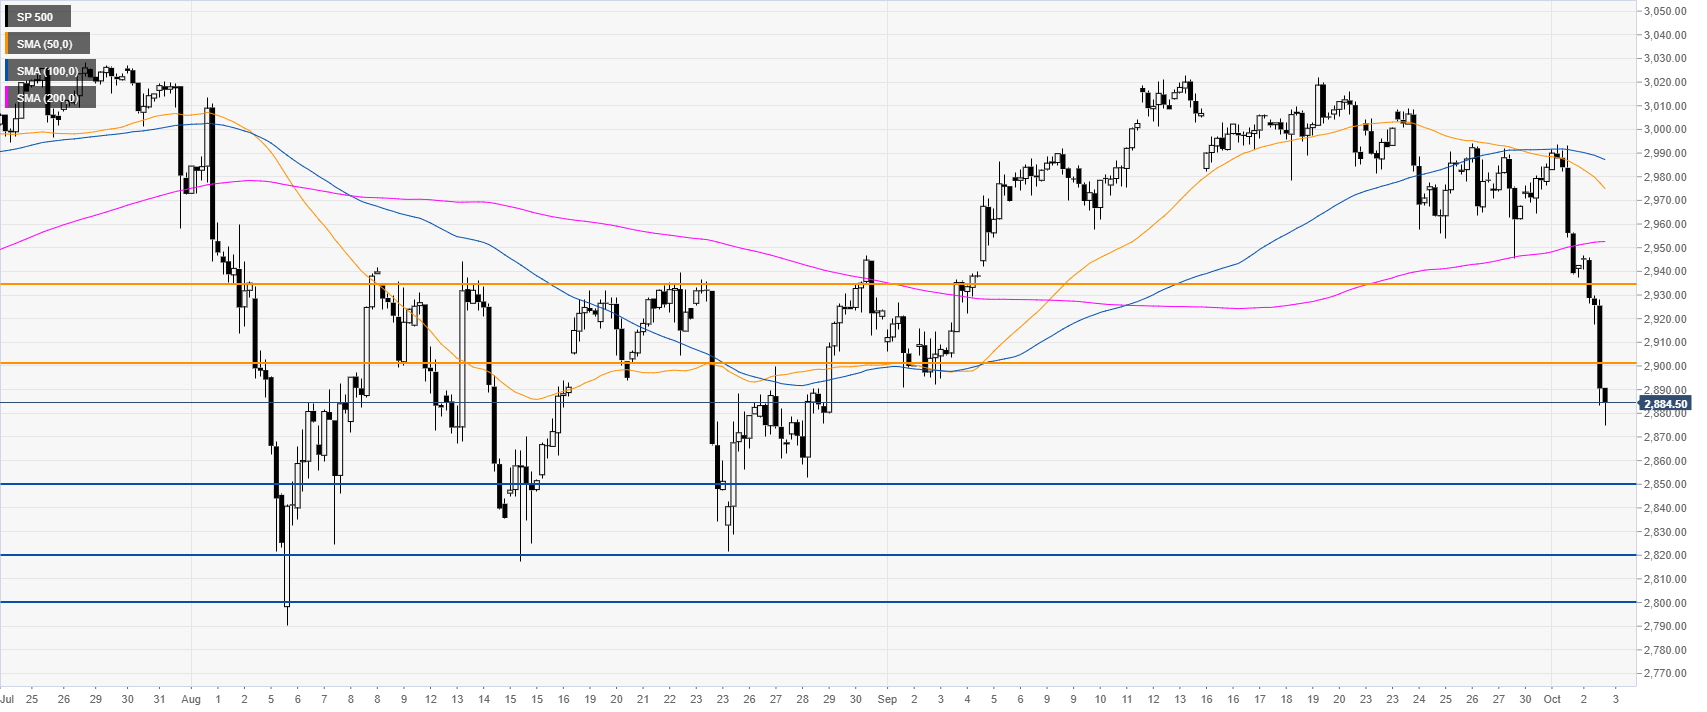
S&P500 four-hour chart
The market is trading below its main SMAs, suggesting bearish momentum in the medium term. The break below the 2,900.00 handle can lead to the 2,850.00 level. Further down lie the 2,822.00 and 2,800.00 figure. Resistances are seen at the 2,900.00 and 2,935.00 levels.
Additional key levels
