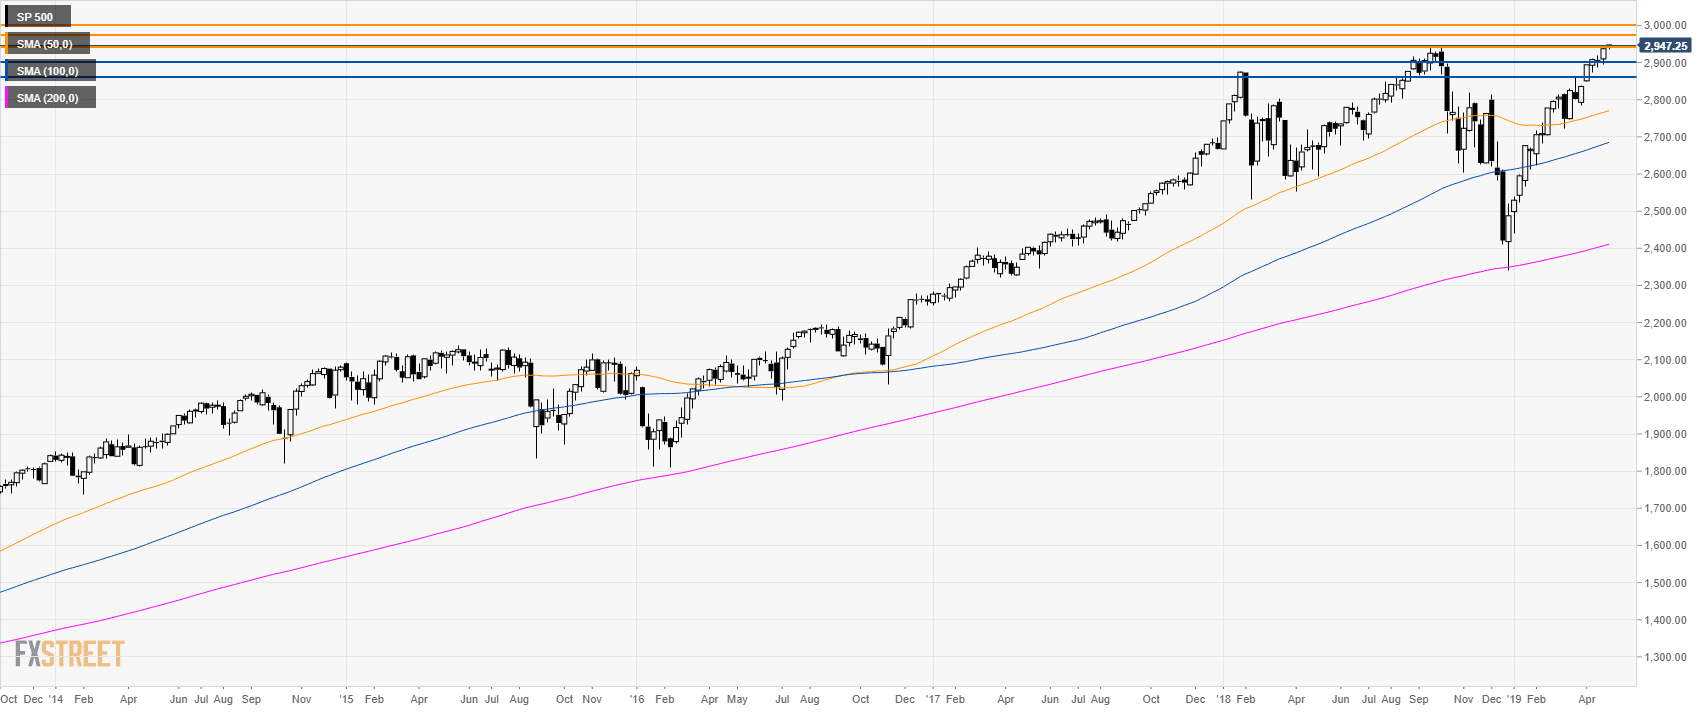
S&P500 weekly chart
- The market is trading to a new all-time high as the S&P500 index hits 2,950.00.
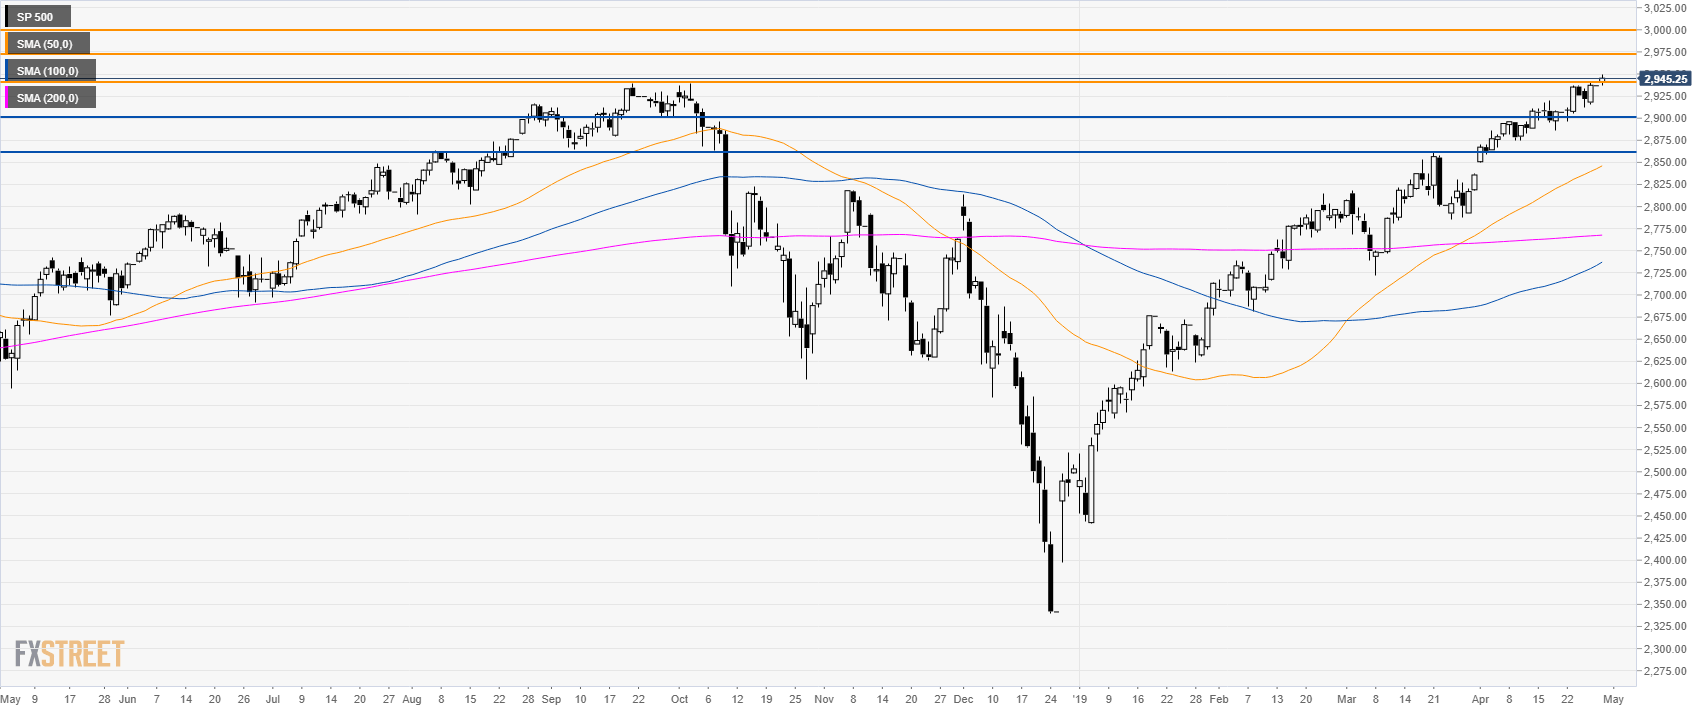
S&P500 daily chart
- Bulls broke above 2,940.50 resistance as the market is in uncharted territory.
- Buyers have likely opened the doors to 2,970.00 and the 3,000.00 psychological level.
- Looking down, support is seen at 2,900.00 and 2,860.00 level.
Additional key levels
