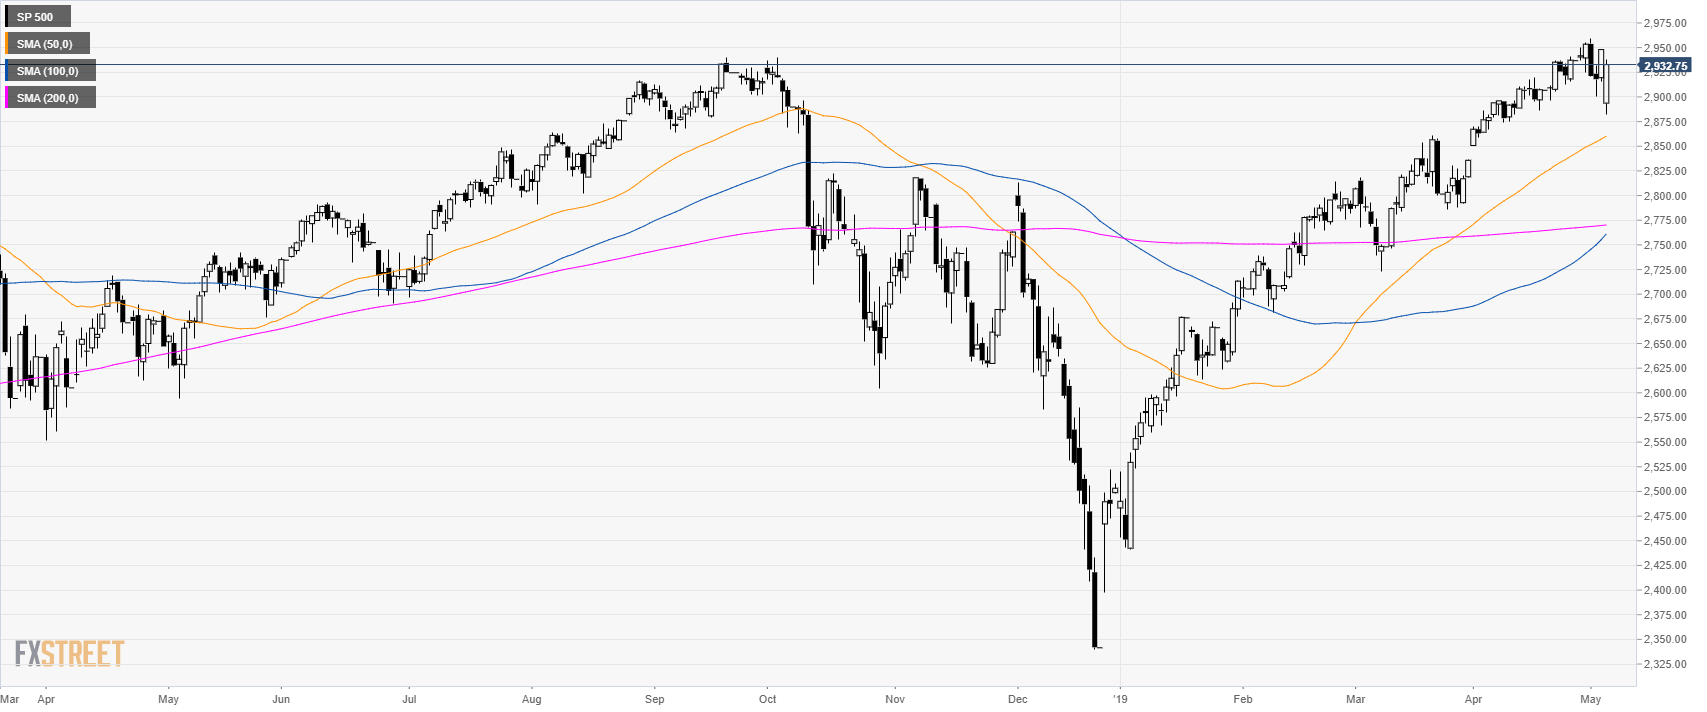
Home S&P500 Technical Analysis: US Stocks climb back to 2,932.00 after opening the week with a gap
FXStreet News

S&P500 Technical Analysis: US Stocks climb back to 2,932.00 after opening the week with a gap

S&P500 daily chart

  • The S&P500 Index is trading in a bull trend above its main SMAs near the all-time high.
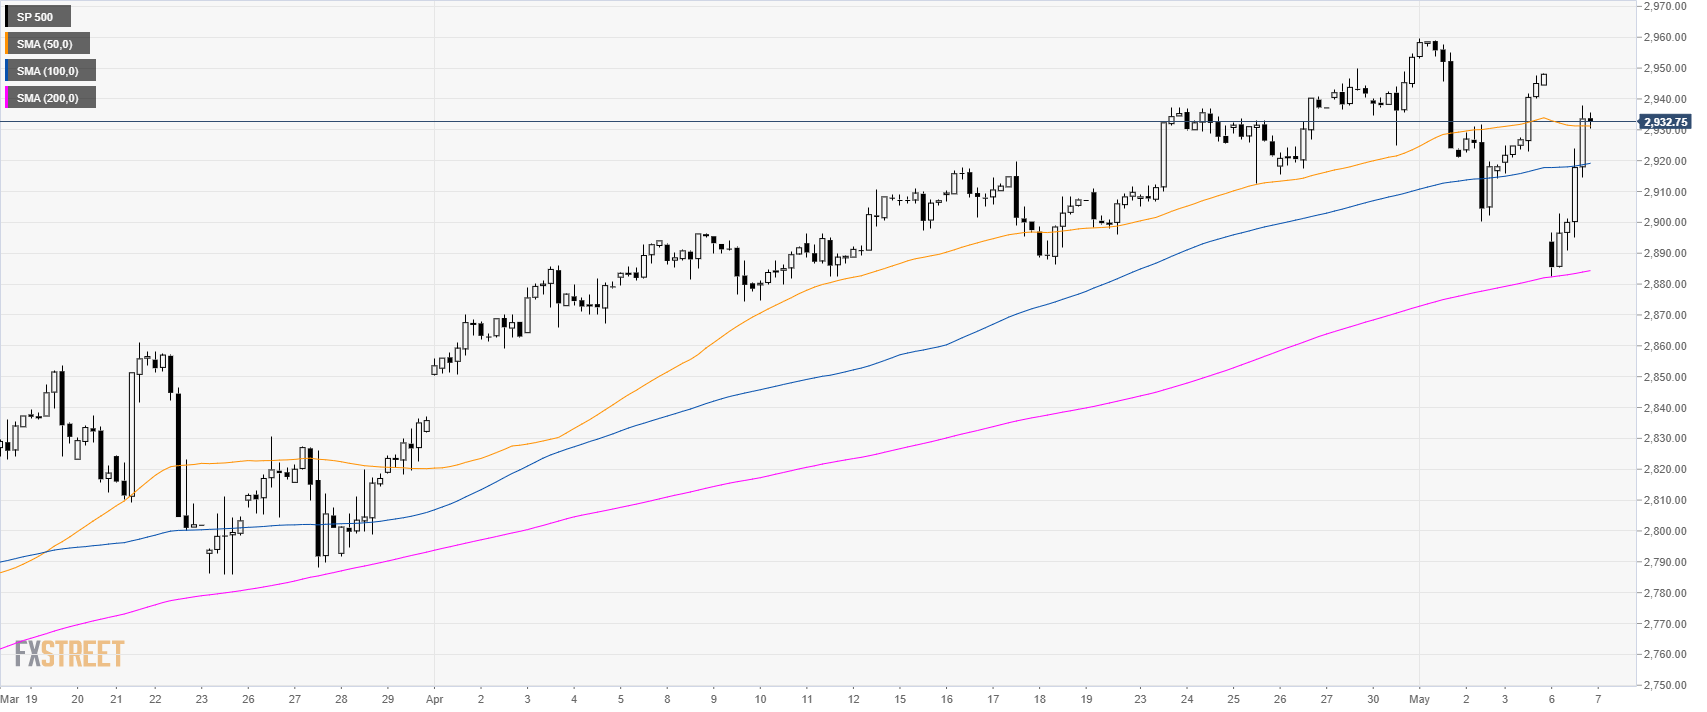

S&P500 4-hour chart

  • The market opened with a large gap however the buying pressure was consistent throughout the day.  

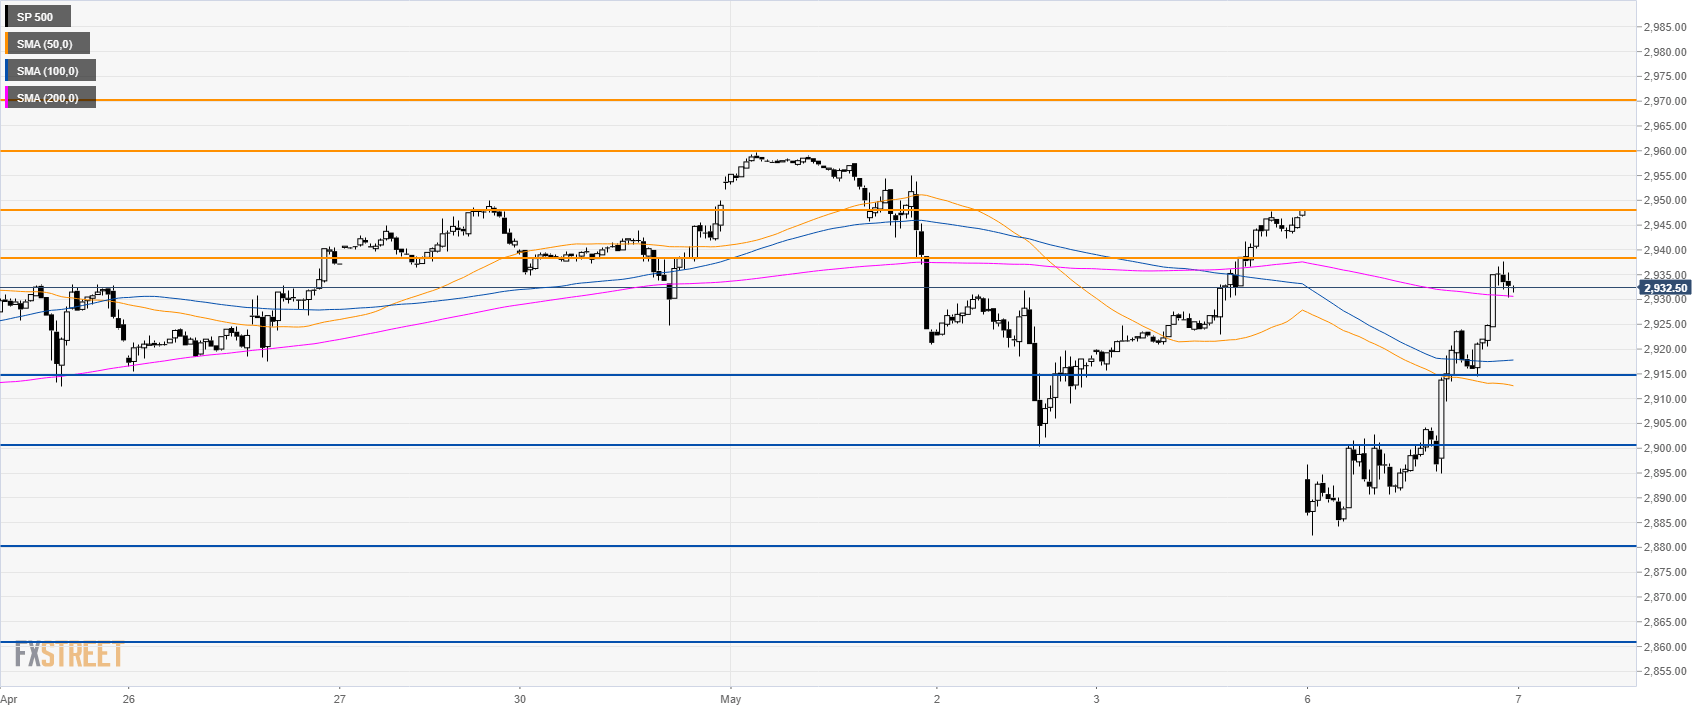
S&P500 30-minute chart

  • The market popped above  the main SMAs which remain sloped to the downside.
  • Bulls would need to overcome 2,938.00 resistance to get to 2,948.00 and 2960.00 to the upside.
  • Support is seen at 2,915 and 2,900.00 level.

Additional key levels


FX Street

FX Street

FXStreet is the leading independent portal dedicated to the Foreign Exchange (Forex) market. It was launched in 2000 and the portal has always been proud of their unyielding commitment to provide objective and unbiased information, to enable their users to take better and more confident decisions.