Home S&P500 technical analysis: US stocks correcting down below the 2,985.00 level
FXStreet News

S&P500 technical analysis: US stocks correcting down below the 2,985.00 level

  • The S&P500 broke below the 2,985.00 support
  • The correction can continue towards 2,965 and the 2,950 level.
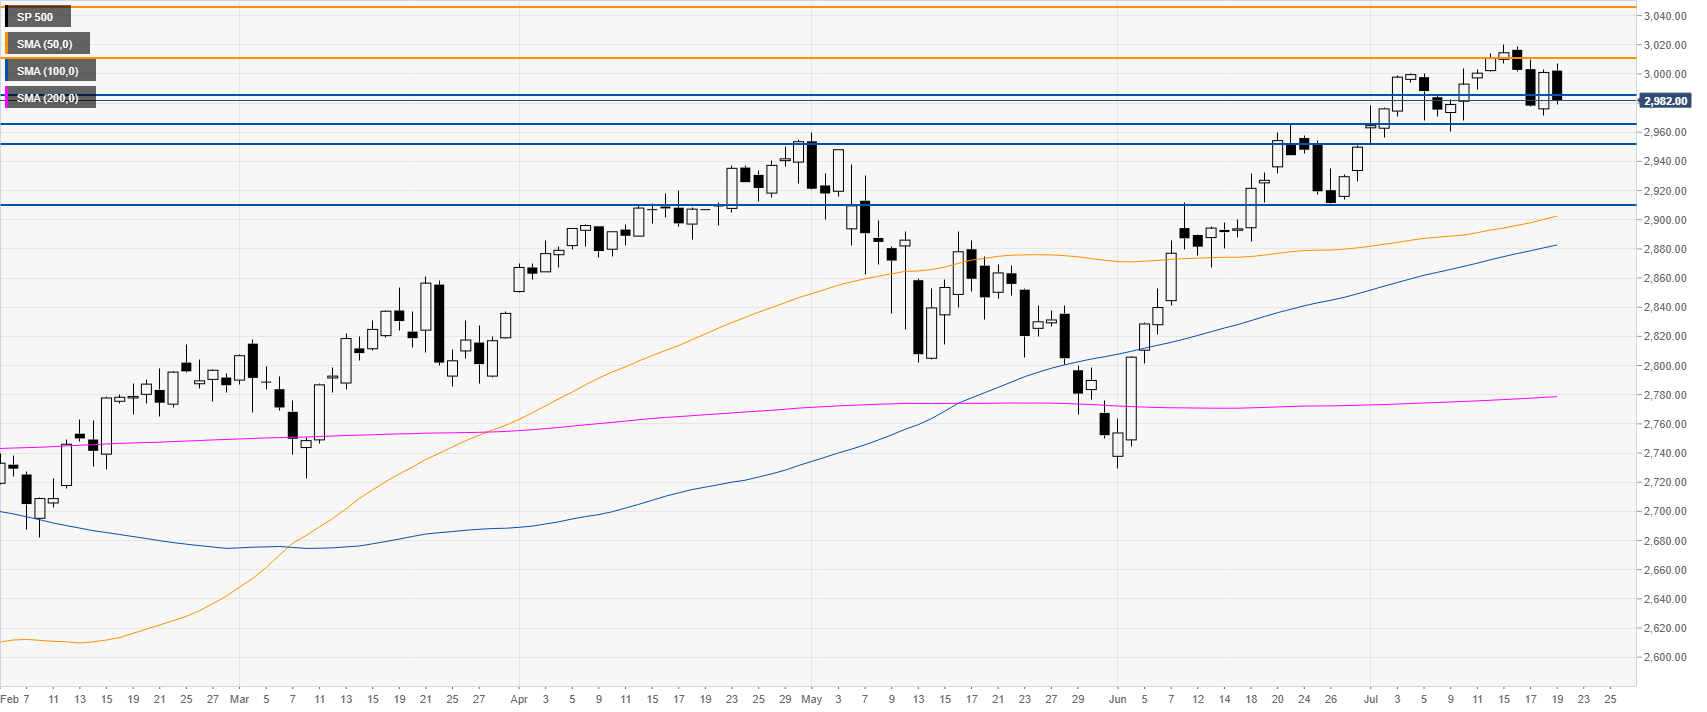
 
S&P500 daily chart

The S&P 500 Index is trading in a bull trend above its main daily simple moving averages (DSMAs). The market. Bulls objective is to keep the trend intact and break above the 3,010.00 level and potentially reach 3,045.00 on the way up.
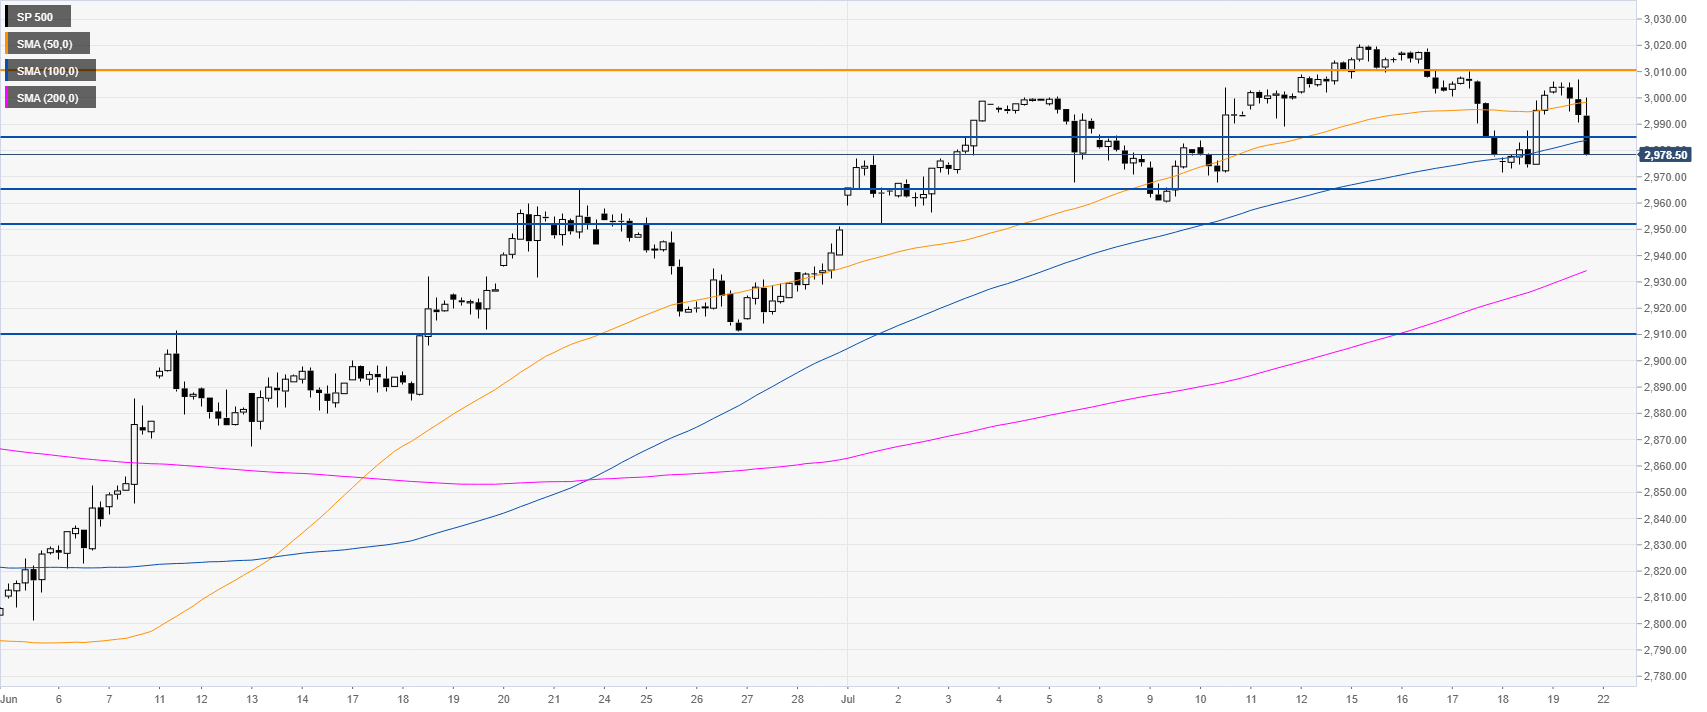
sp500 daily chart
S&P500 4-hour chart

Bears broke below the 2,985.00 support and the 100 SMA. The correction down can extend towards 2,965.00 and 2,950.00.

sp500 4-hour chart
Additional key levels


FX Street

FX Street

FXStreet is the leading independent portal dedicated to the Foreign Exchange (Forex) market. It was launched in 2000 and the portal has always been proud of their unyielding commitment to provide objective and unbiased information, to enable their users to take better and more confident decisions.