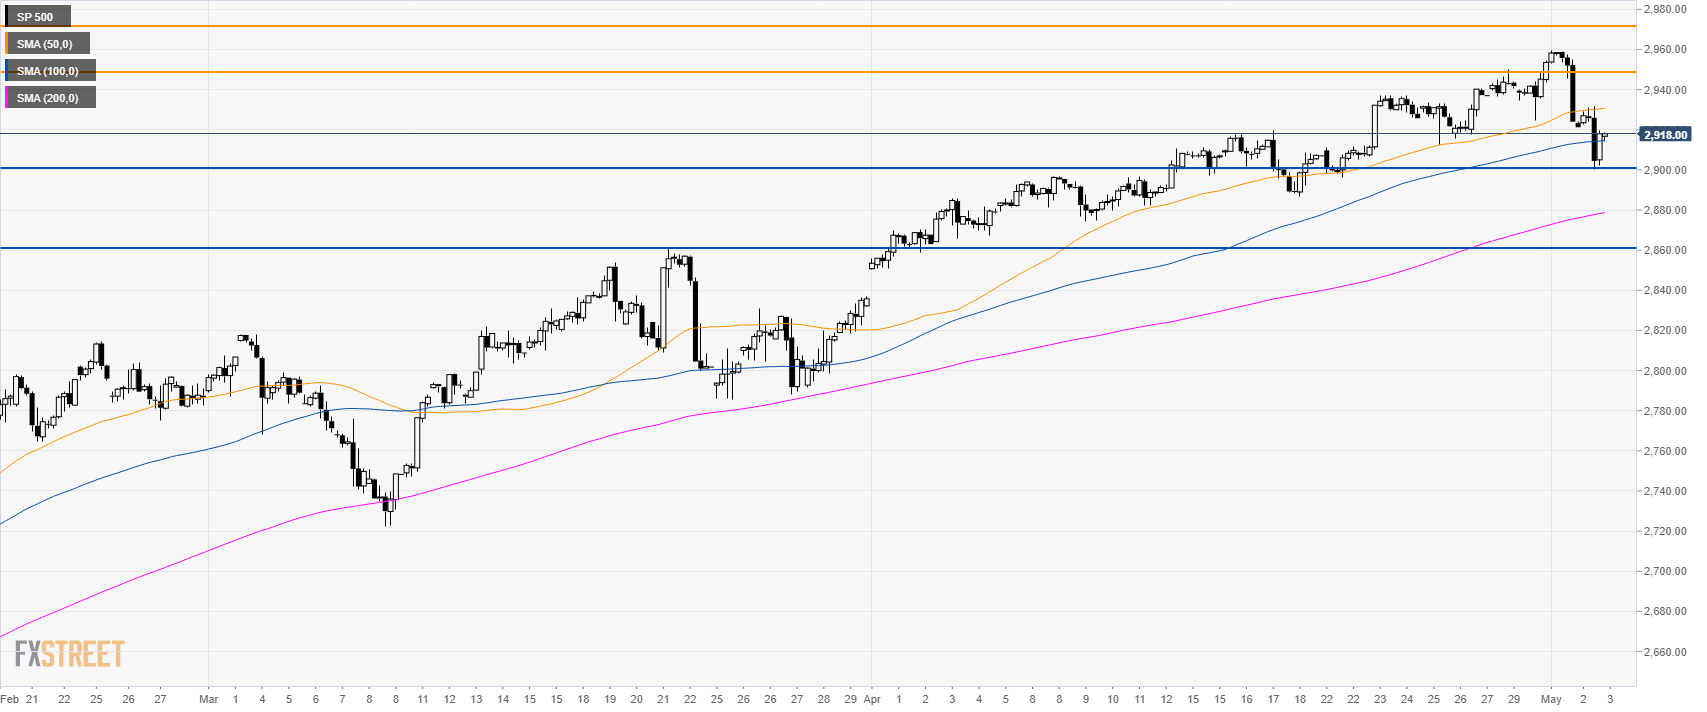
S&P500 daily chart
- The market retreated after reaching an all-time high at 2,959.75.
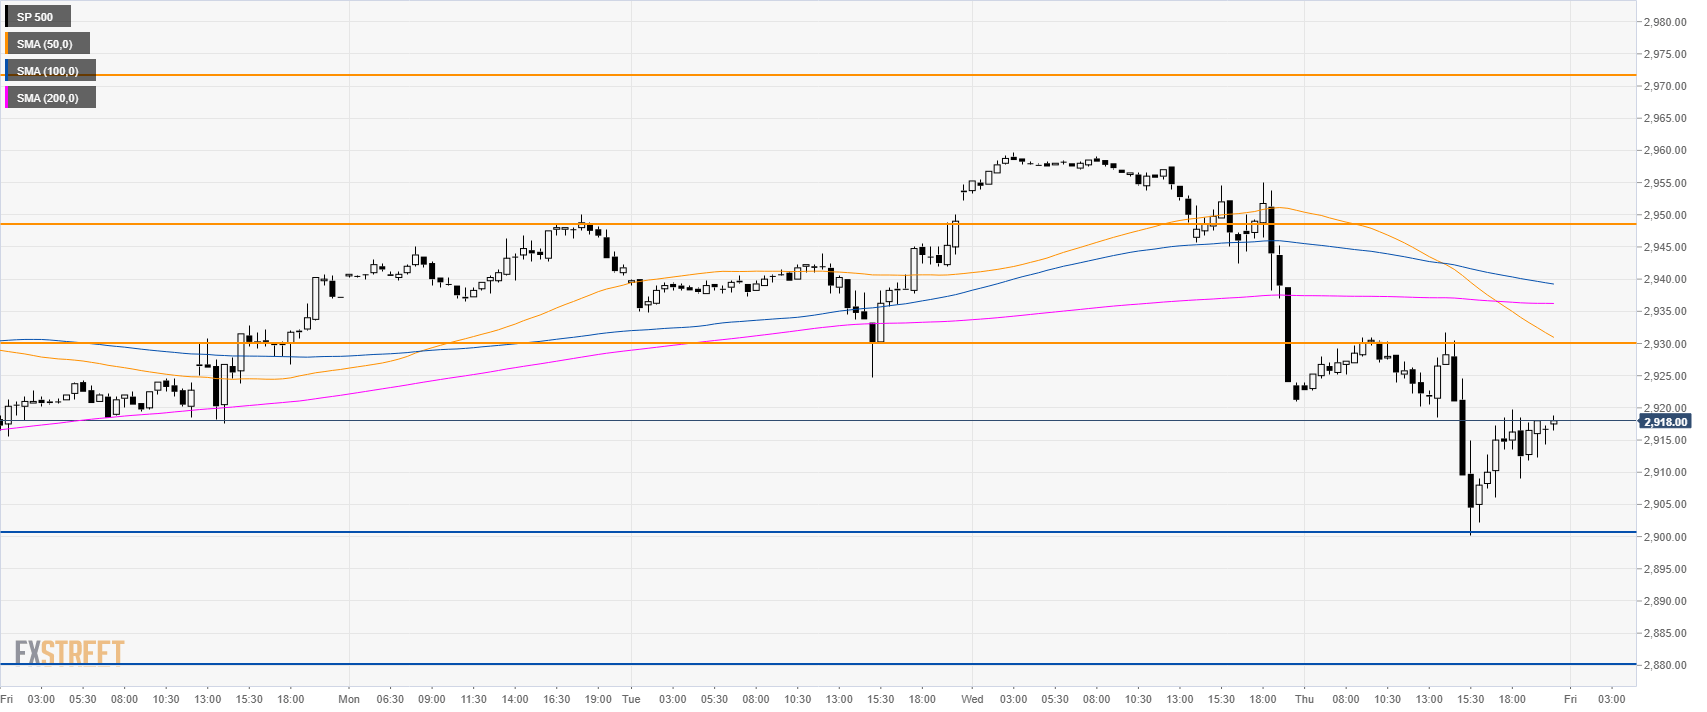
S&P500 4-hour chart
- The market found support at the 2,900.00 mark.
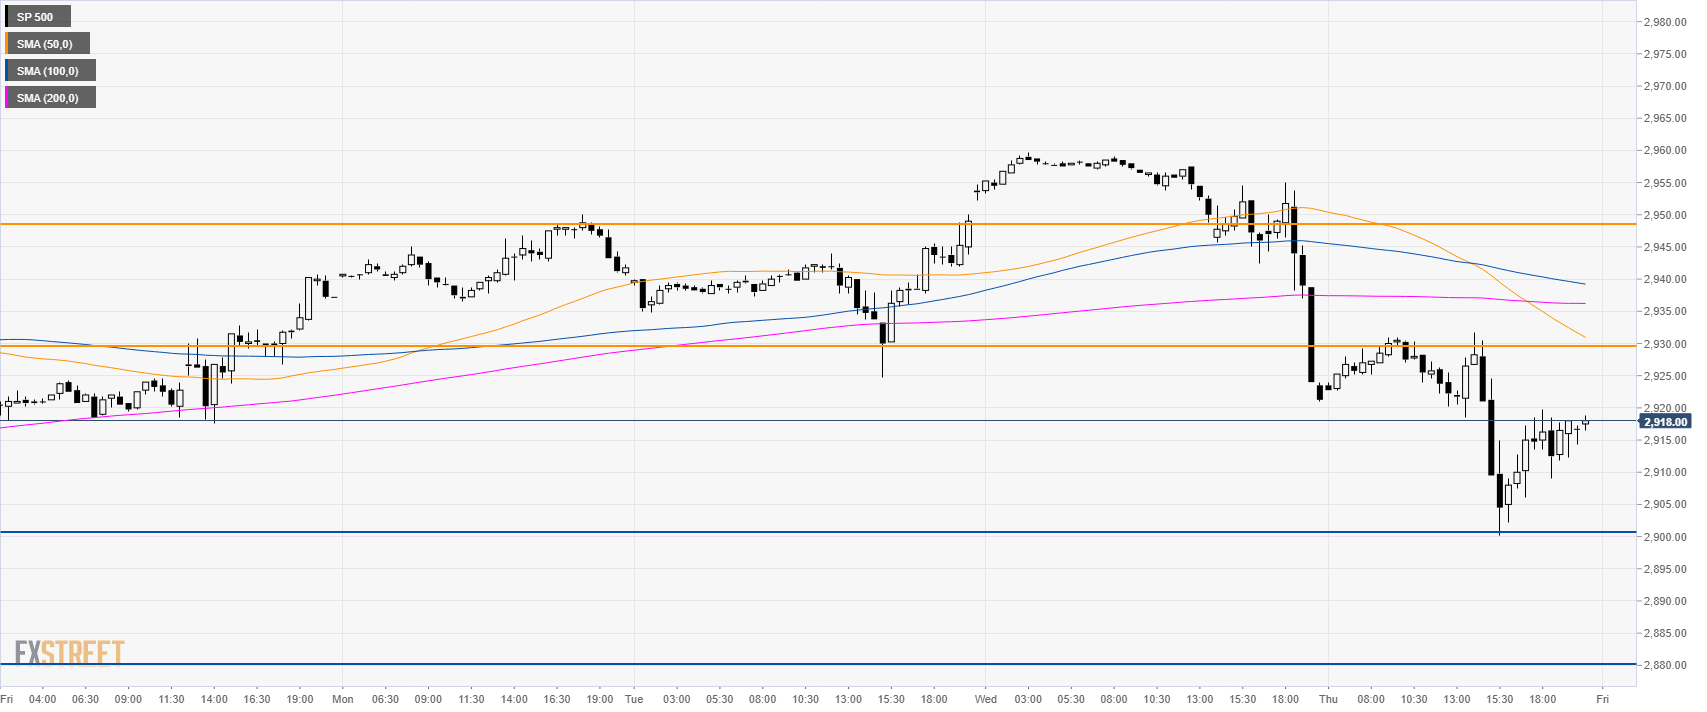
S&P500 30-minute chart
- The index is trading below its main SMAs suggesting bearish momentum in the short-term.
- If bears break the 2,900.00 figure a continuation down to 2,880.00 can be on the cards.
- Resistances are seen at 2,930.00 and 2,948.00 level.
Additional key levels
