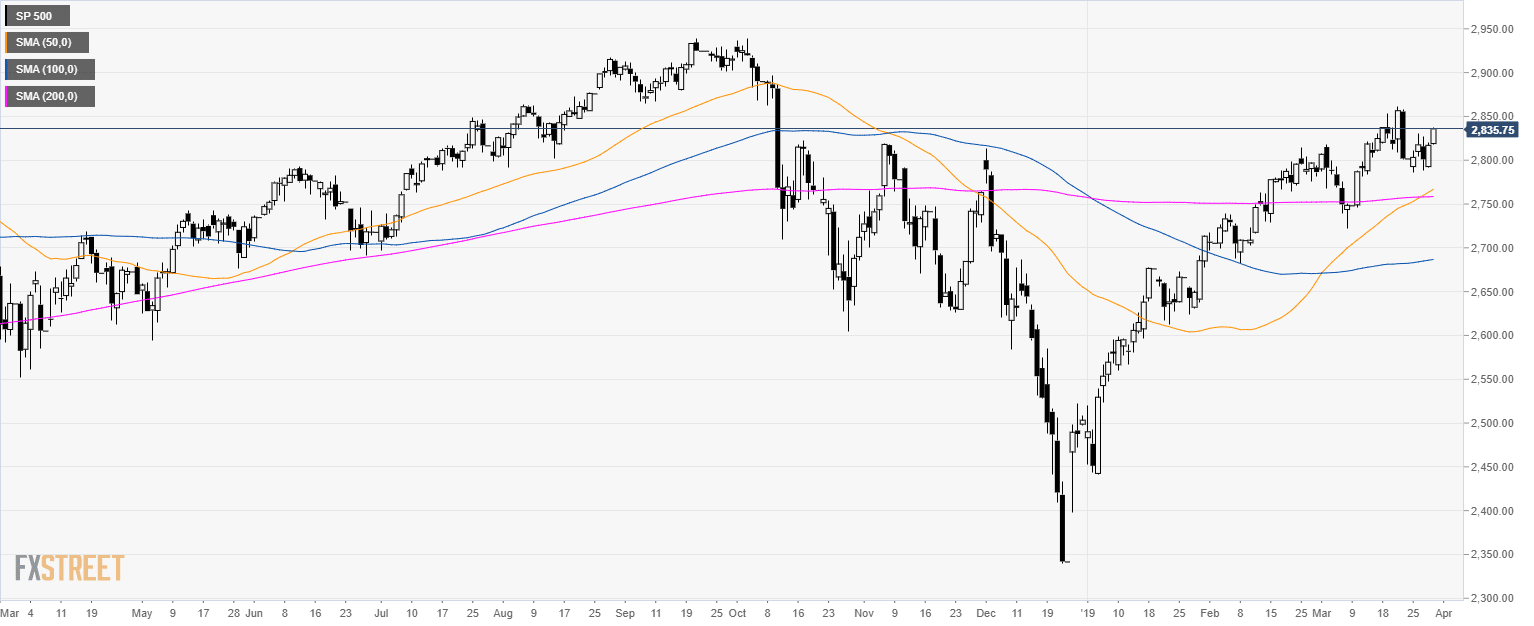
Home S&P500 Technical Analysis: US Stocks ends up the week on their highs near 2,835.00 level
FXStreet News

S&P500 Technical Analysis: US Stocks ends up the week on their highs near 2,835.00 level

S&P500 daily chart

  • The S&P500 is trading above its main simple moving average suggesting bullish momentum.
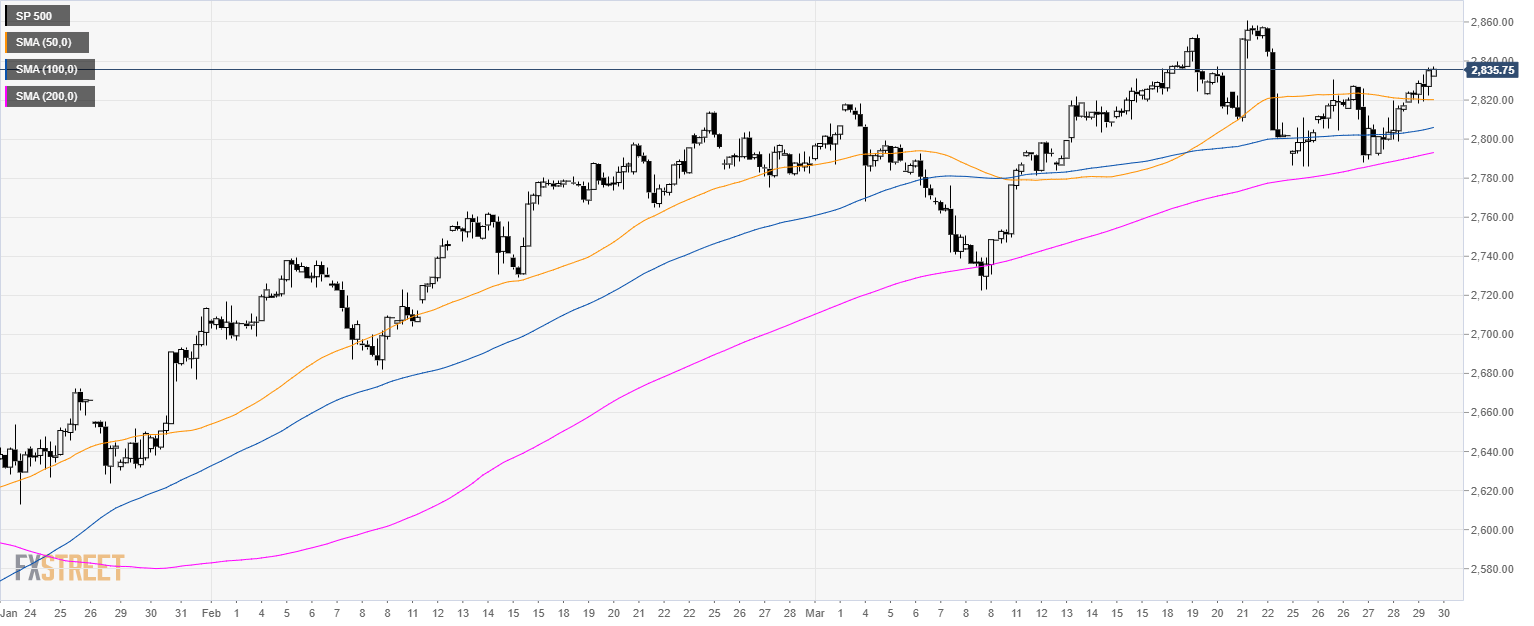
S&P500 4-hour chart

  • The S&P500 is trading above its main SMAs suggesting a bullish bias in the medium-term.

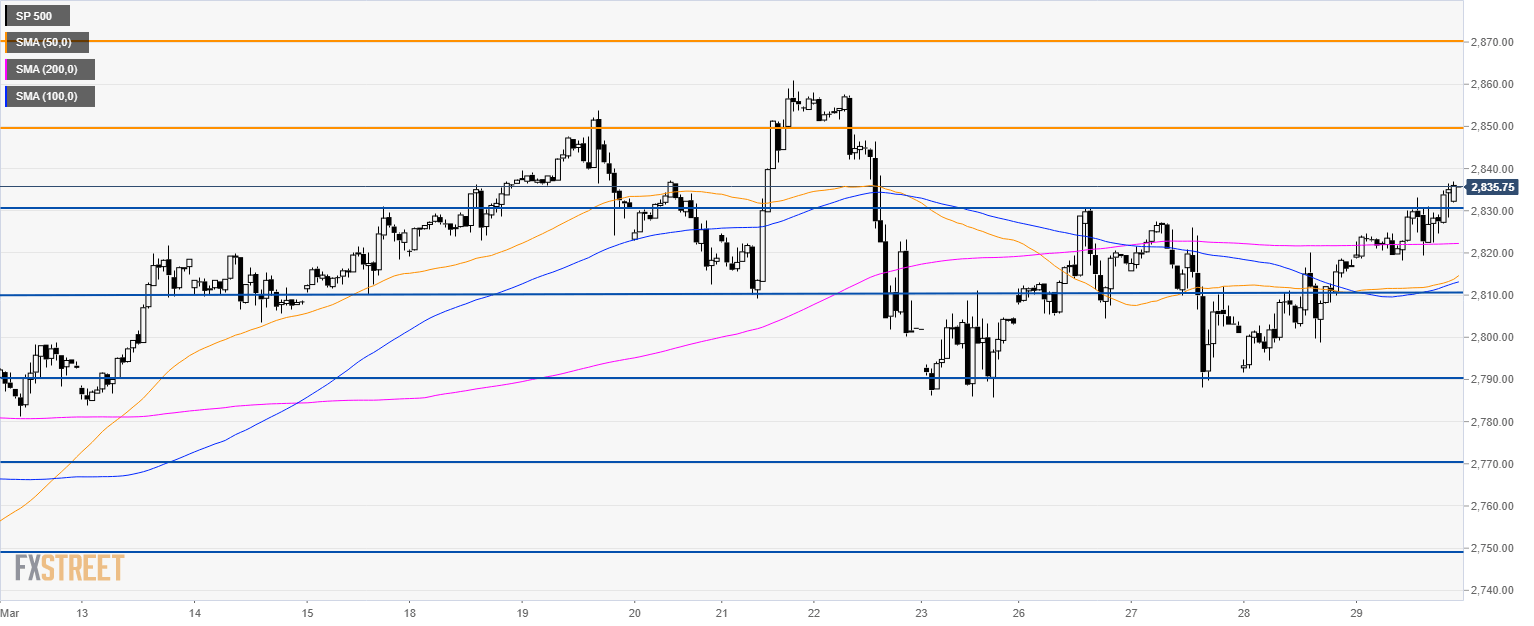
S&P500 60-minute chart

  • The S&P500 is trading above its main SMAs suggesting bullish momentum in the short-term.
  • The break above 2,830.00 can drive the market to 2,850.00 and 2,870.00 resistance.
  • To the downside, support is at 2,810.00; 2,790.00 and 2,770.00 level.

Additional key levels


FX Street

FX Street

FXStreet is the leading independent portal dedicated to the Foreign Exchange (Forex) market. It was launched in 2000 and the portal has always been proud of their unyielding commitment to provide objective and unbiased information, to enable their users to take better and more confident decisions.