- The S&P500 broke above the 2,910.00 resistance after two weeks of consolidations.
- The level to beat for bulls is seen at 2,940.00 resistance.
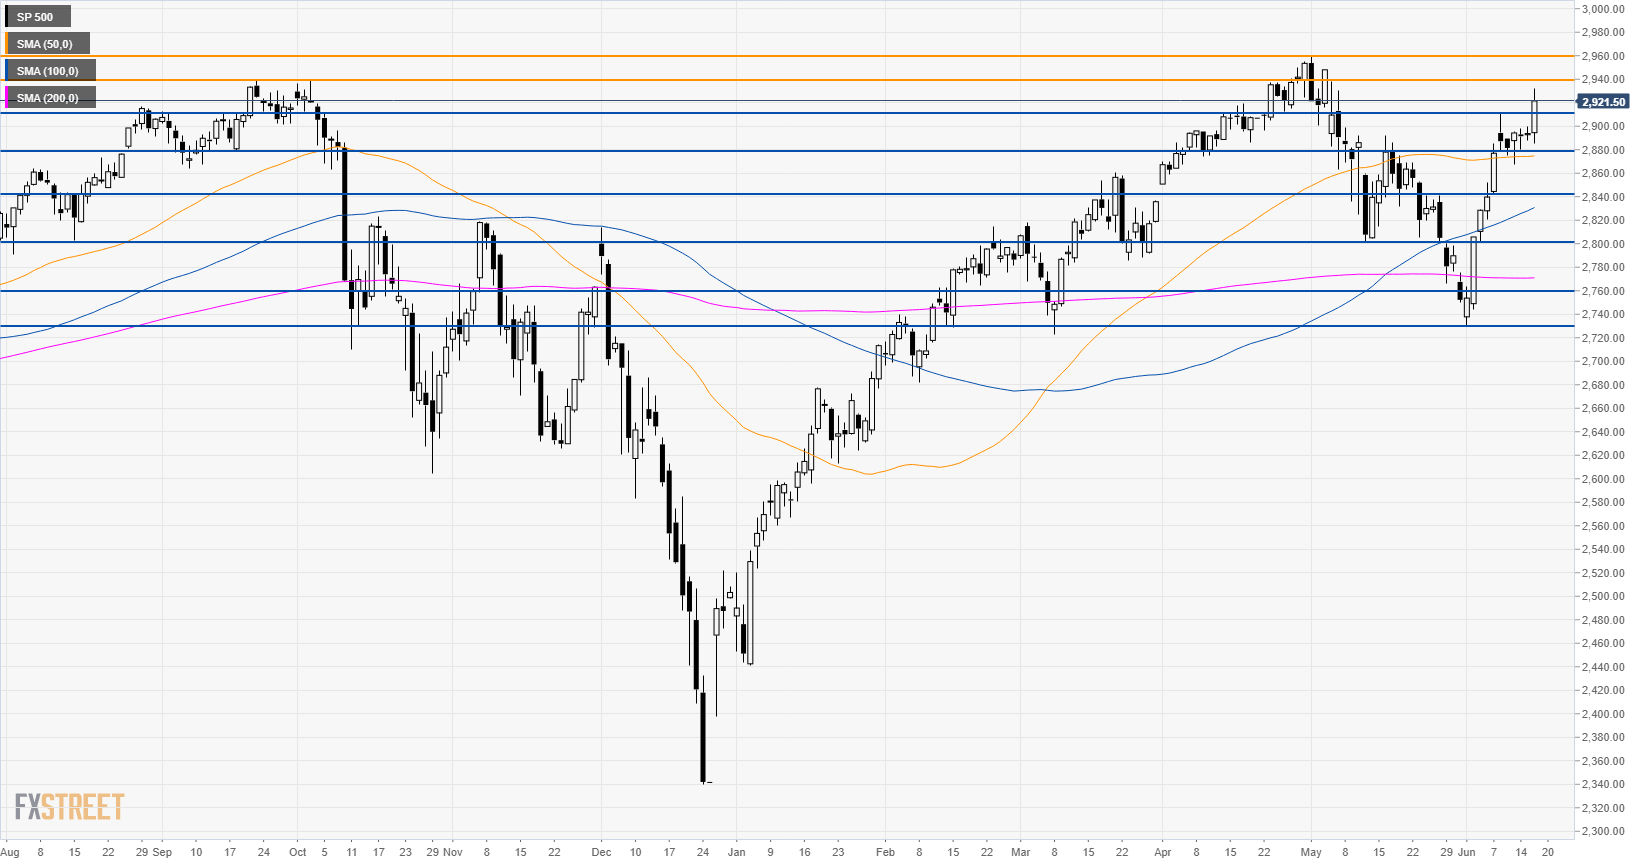
S&P500 daily chart
The S&P500 finally broke above the 2,910.00 resistance. The market is bullish above the main daily simple moving averages (DSMAs).
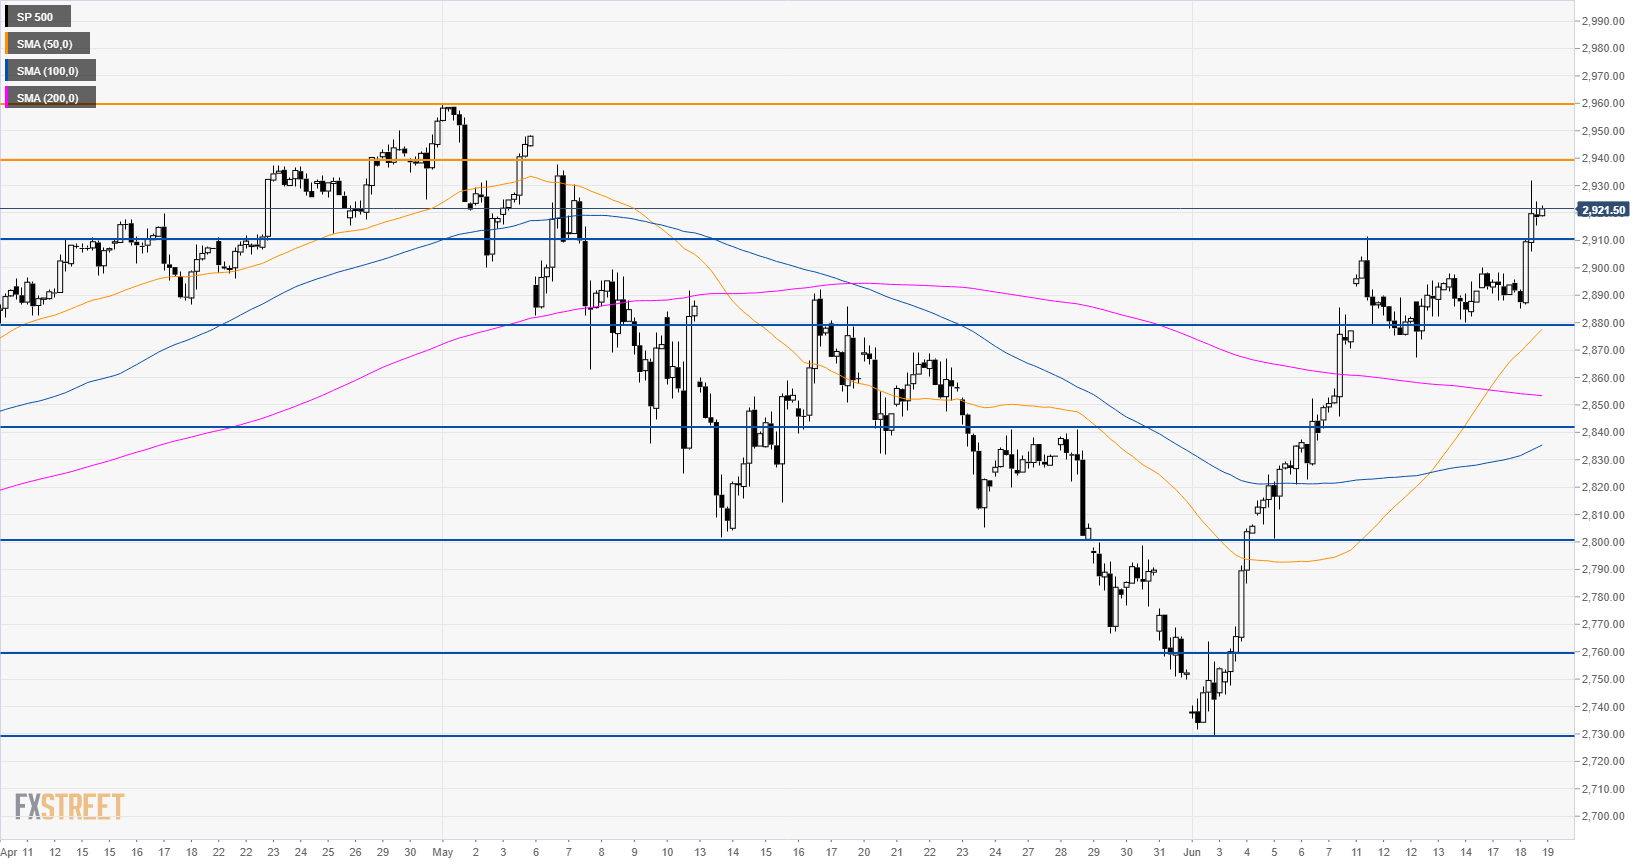
S&P500 4-hour chart
The stock index is trading above its main SMAs suggesting bullish momentum in the medium term. The 50 SMA crossed above the 200 SMA confirming the bullish action. Buyers intend to reach 2,940.00 and 2,960.00 resistances. Immediate support can be located at 2,910.00 and 2,880.00.
Additional key levels
