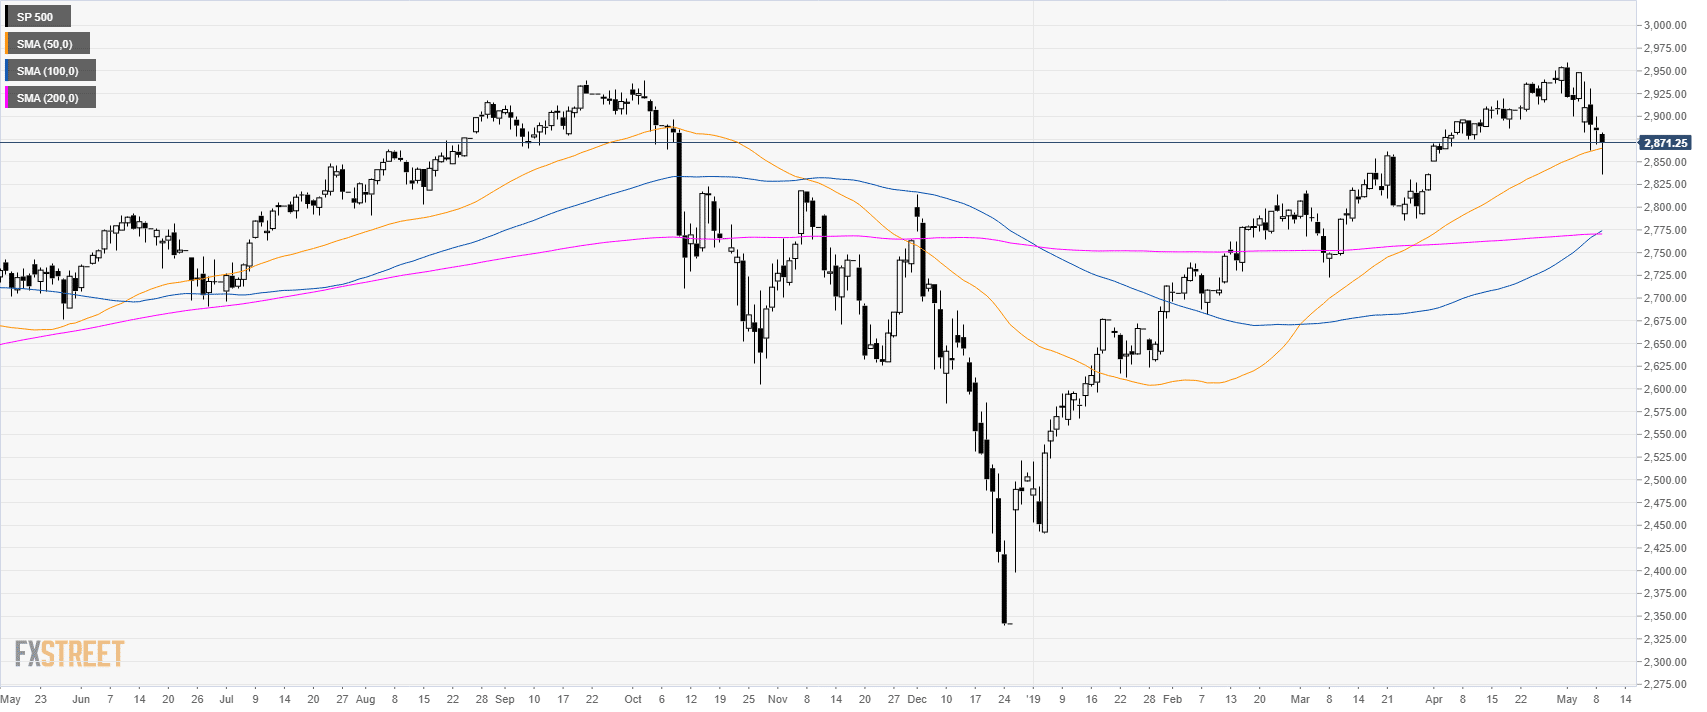
S&P500 daily chart
The S&P500 Index is trading in a bull trend above its main simple moving averages (SMAs). The market dropped as low as 2,836.00 as it is about to close above the 50 SMA.
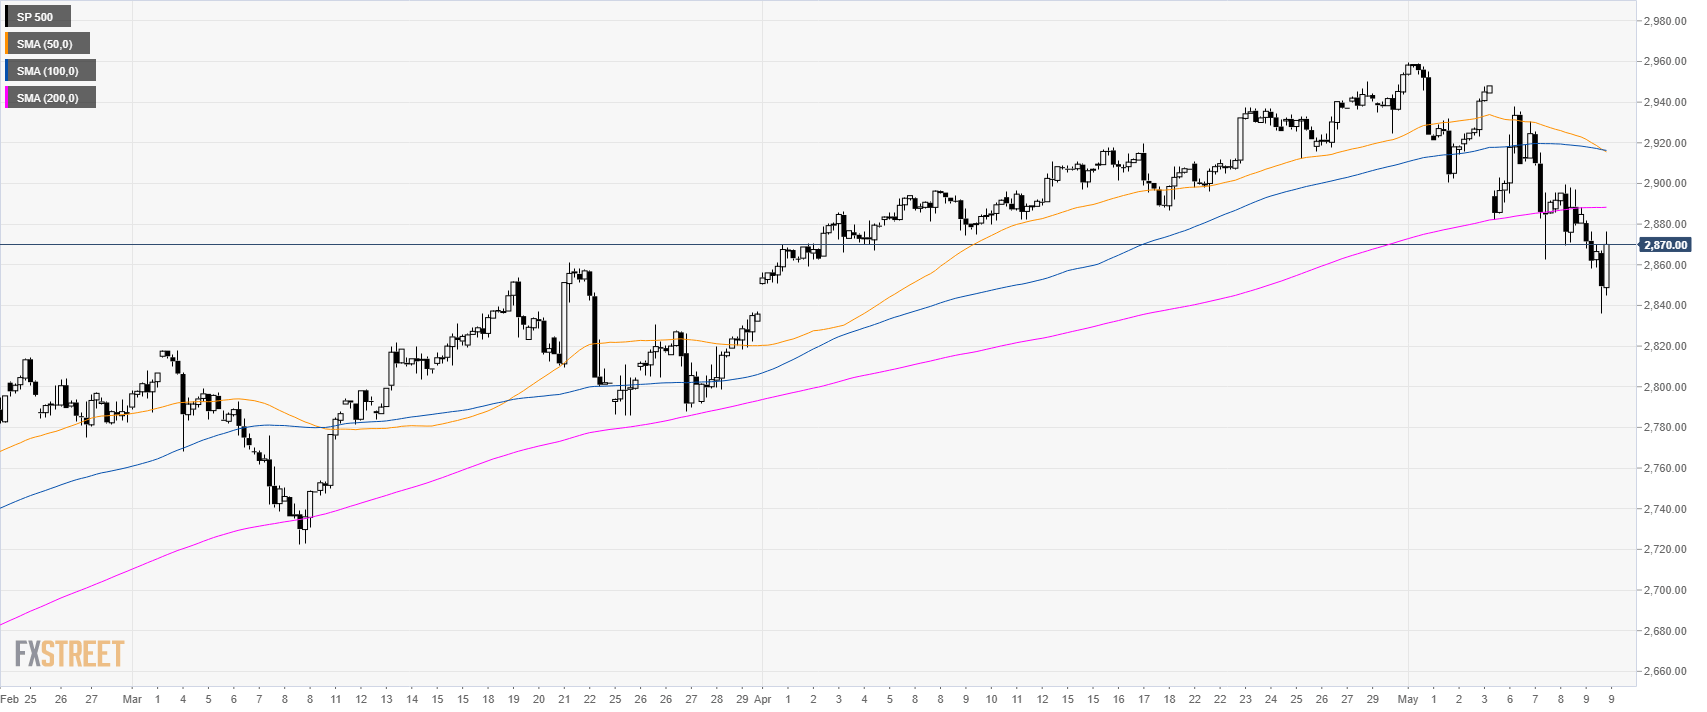
S&P500 4-hour chart
The market is trading below the main SMAs suggesting bearish pressure in the medium term.
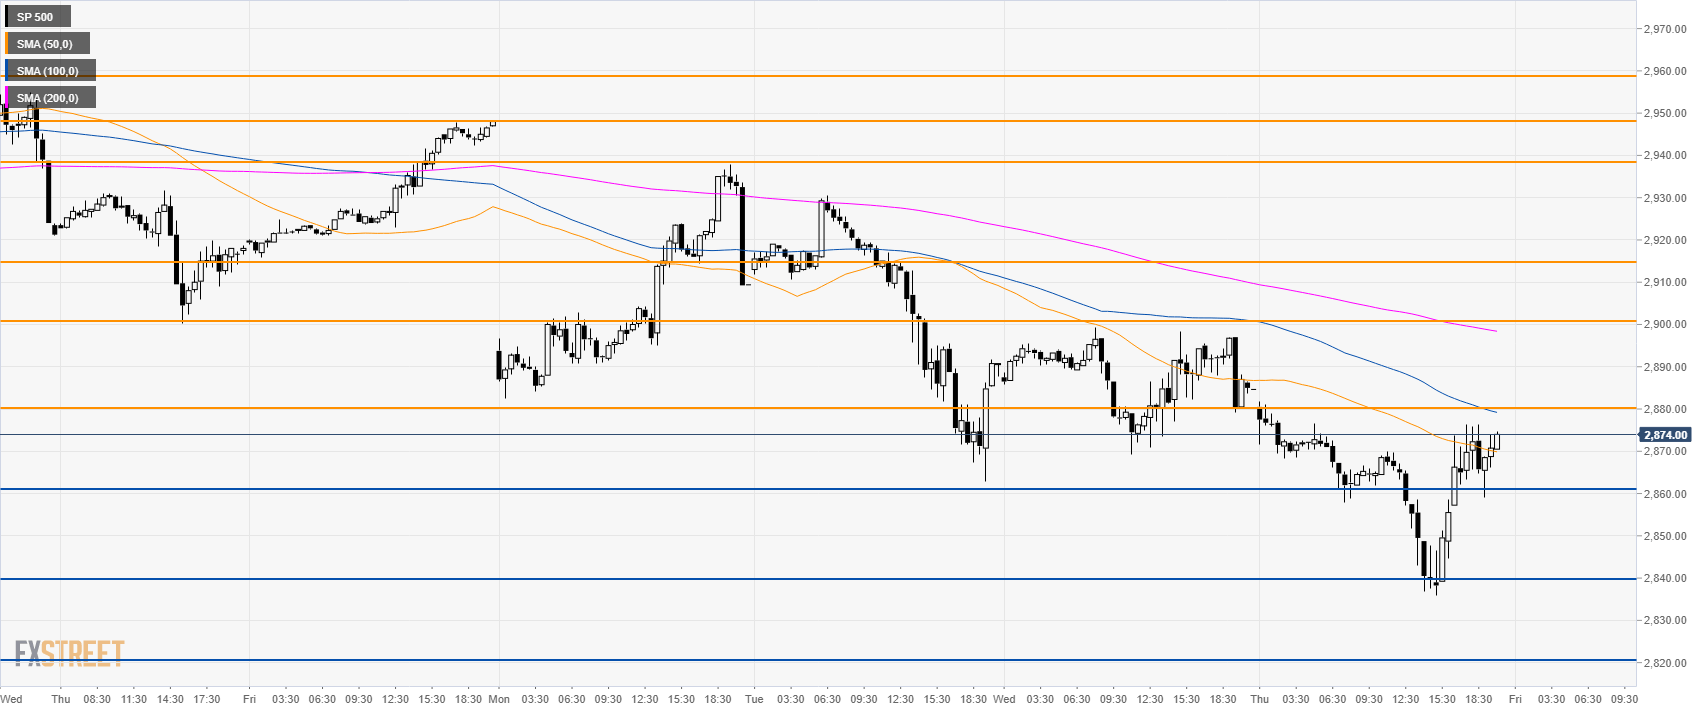
S&P500 30-minute chart
The bears reached 2,840.00 support from which the market is having a rebound.
If bulls can break above 2,880.00 resistance then 2,900.00.00 can be back on the cards for bulls.
On the flip side, if bears break 2,840.00 then 2,820.00 and 2,800.00 can be next.
Additional key levels
