- The S&P500 spent the week in consolidation mode just above 2,880.00 support
- The level to beat for bulls is the 2,910.00 resistance.
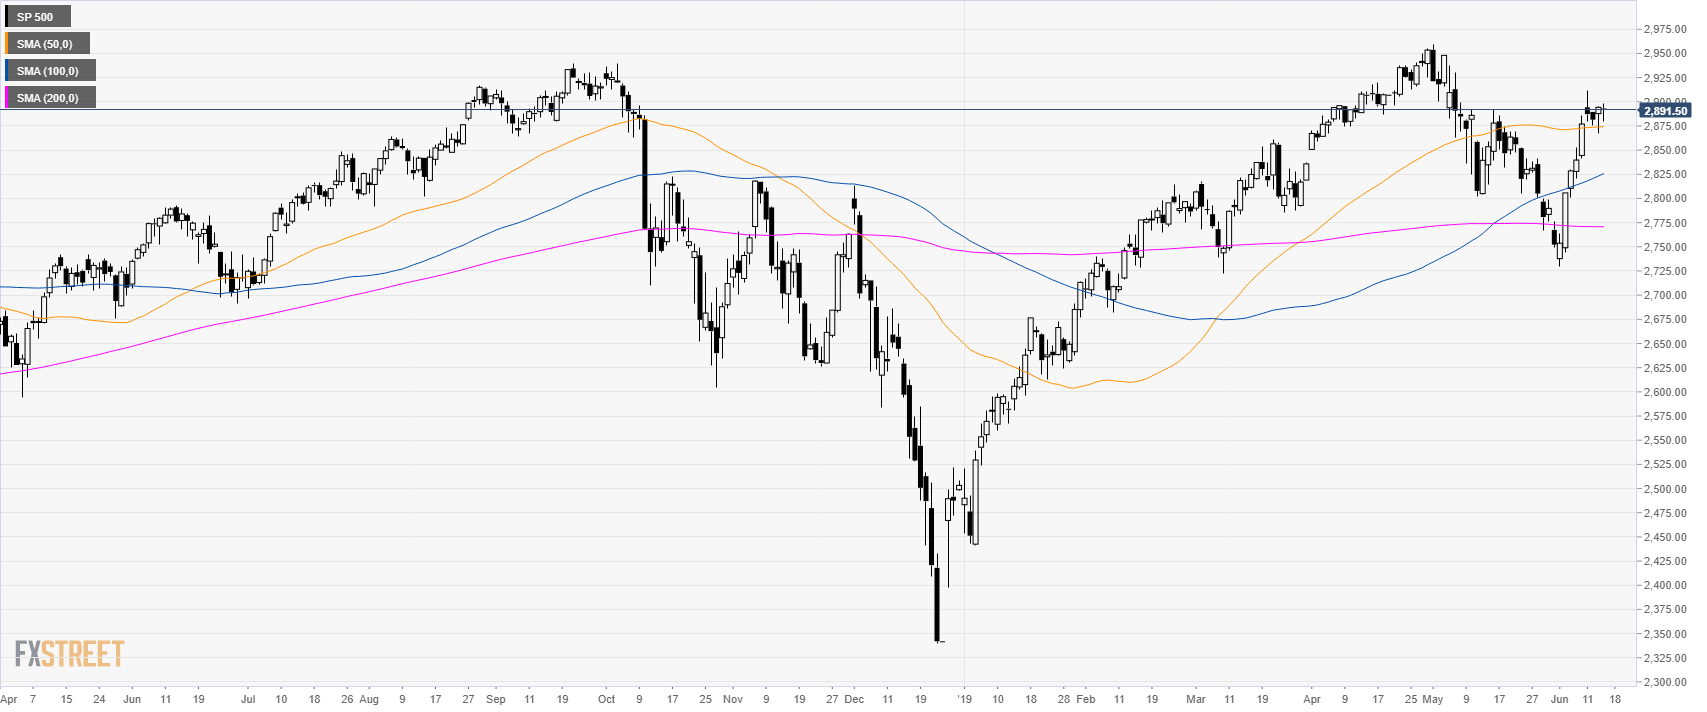
S&P500 daily chart
The S&P500 Index is consolidating the gains of the last weeks below the 2,900.00 handle. The market remains bullish above its main daily simple moving averages (DSMAs).
S&P500 4-hour chart
The stock index is trading above its main SMAs suggesting bullish momentum in the medium term. Bulls are looking for a break above 2,910.00 to reach 2,940.00 and 2,960.00. Immediate support can be located at 2,880.00 and 2,840.00.
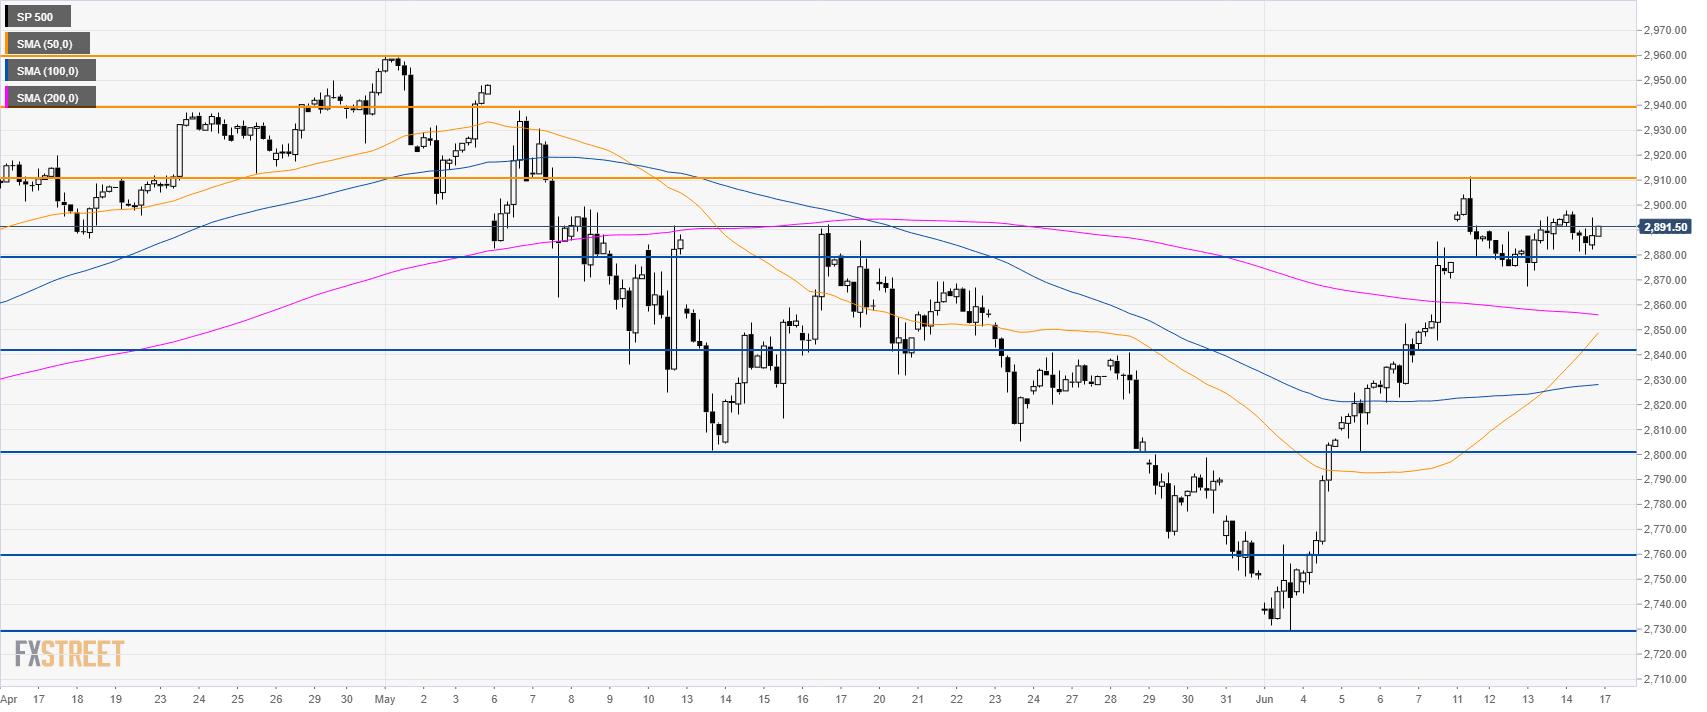
Additional key levels
