- XLM is currently trading at $0.081 after defending a critical support level.
- XLM bulls are trying to create a bounce on the daily chart.
Stellar is still up by more than 200% since the crash on March 12 but has lost a considerable chunk of market capitalization over the past month from a high of $2.43 billion to a current low of $1.68 billion.
XLM/USD daily chart
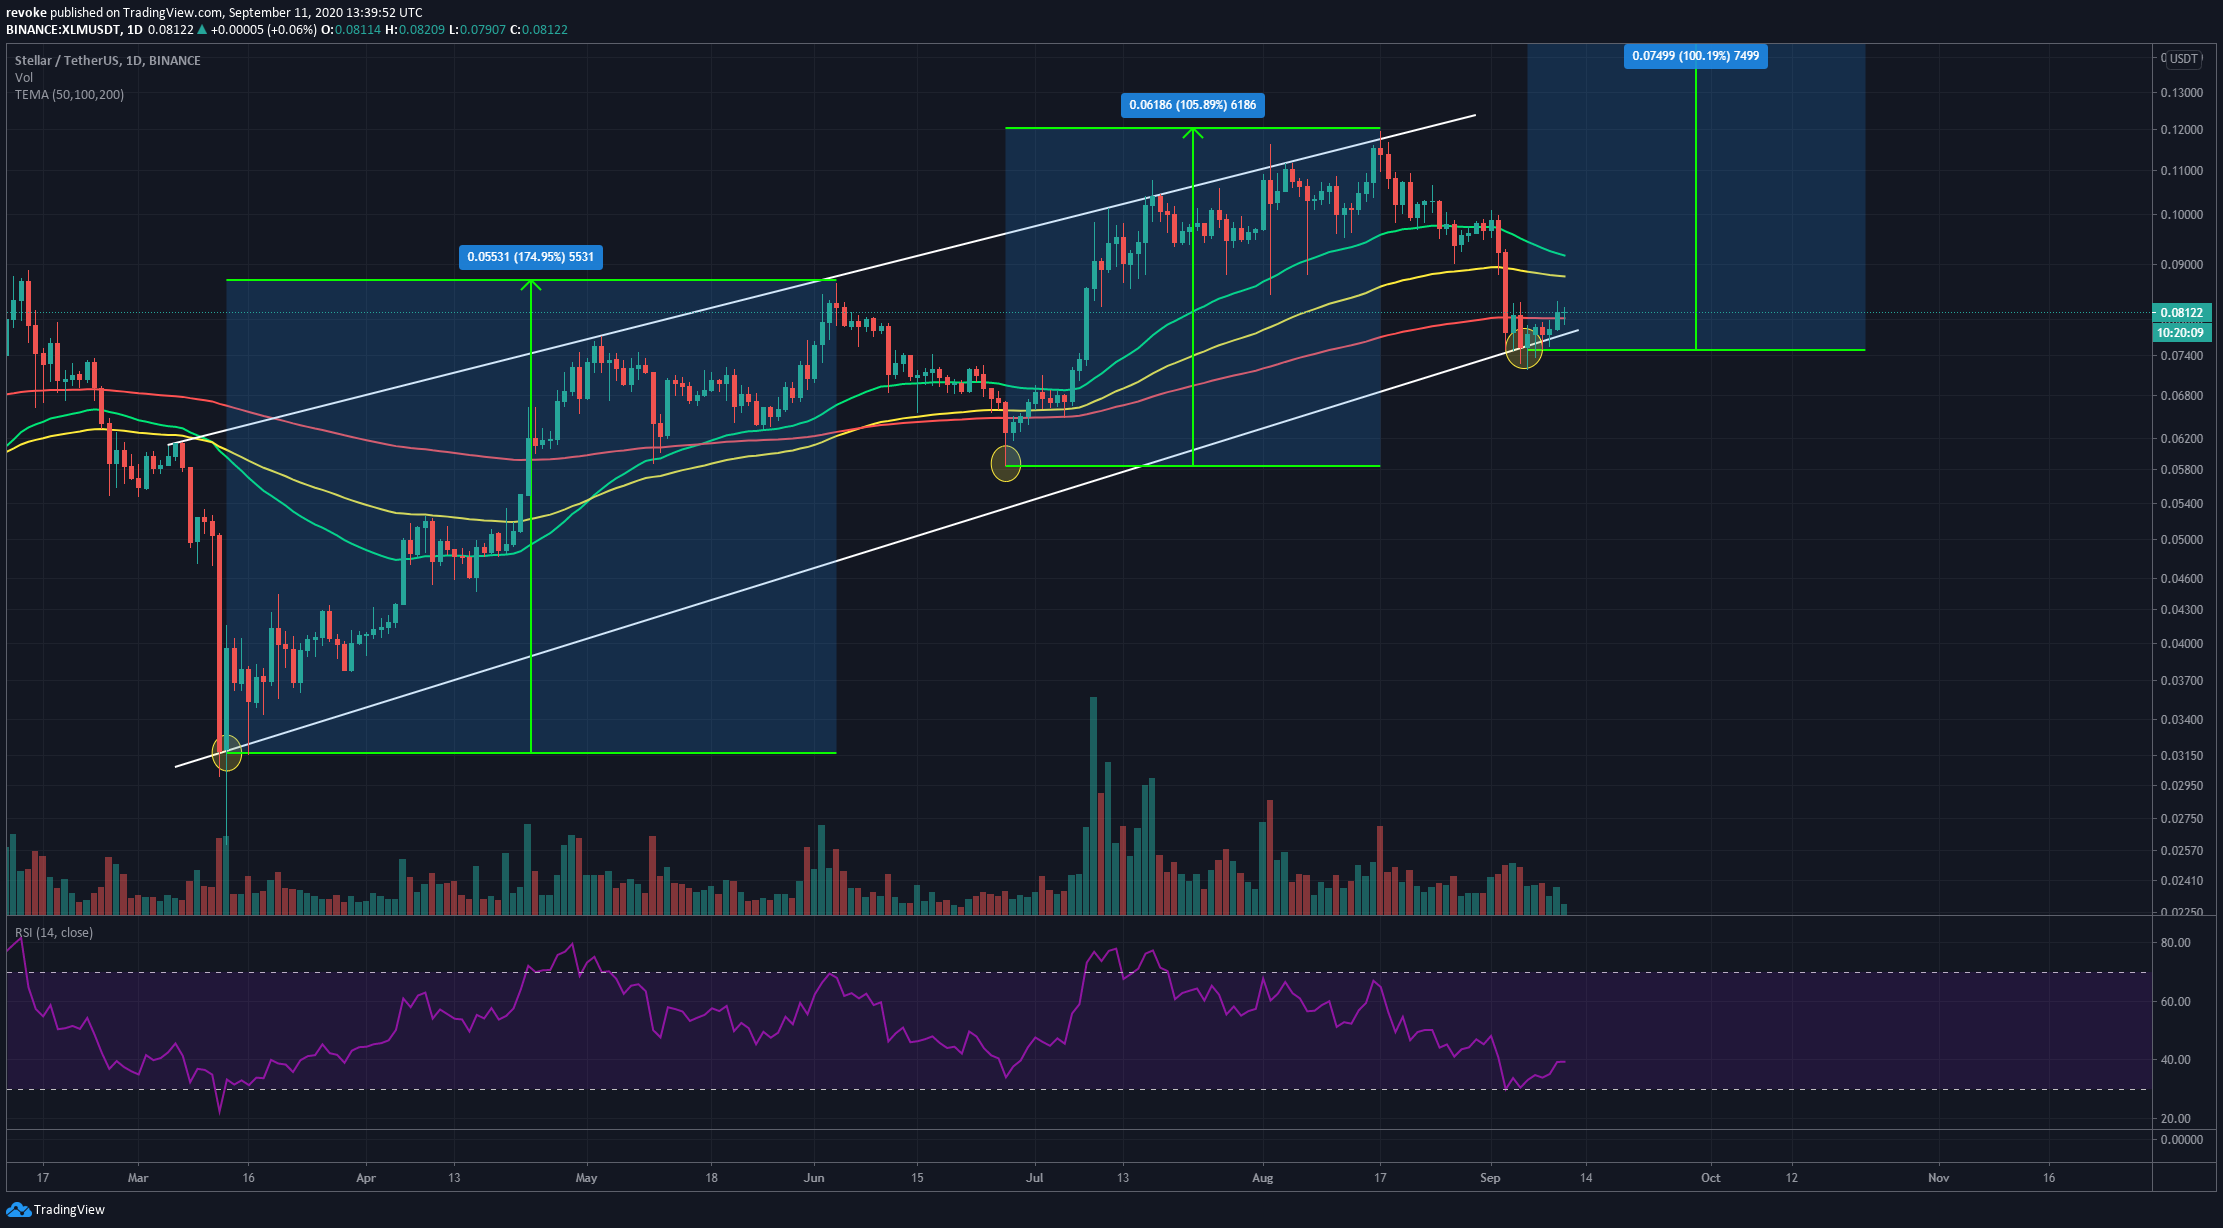
XLM has painted a clear parallel channel on the daily chart. The lower trendline was defended seven days in a row during this month. After a massive 15.6% crash on September 3, the RSI got overextended, and the price touched the lower trendline. Bulls quickly jumped in and bought the dip, pushing XLM above the daily 200-MA.
The open-source network is now just above the 200-MA and experiencing a significant decrease in trading volume. The first time XLM price touched the lower trendline was on March 12. Several months later, the digital asset saw a 175% bounce. Similarly, on June 27, after getting close to the lower trendline again, the price bounced 105%, setting a new 2020-high at $0.1149.
Considering that the bulls have defended the lower trendline again, we could see another 100% bounce towards $0.16 over the next couple of months.
XLM/USD 4-hour chart
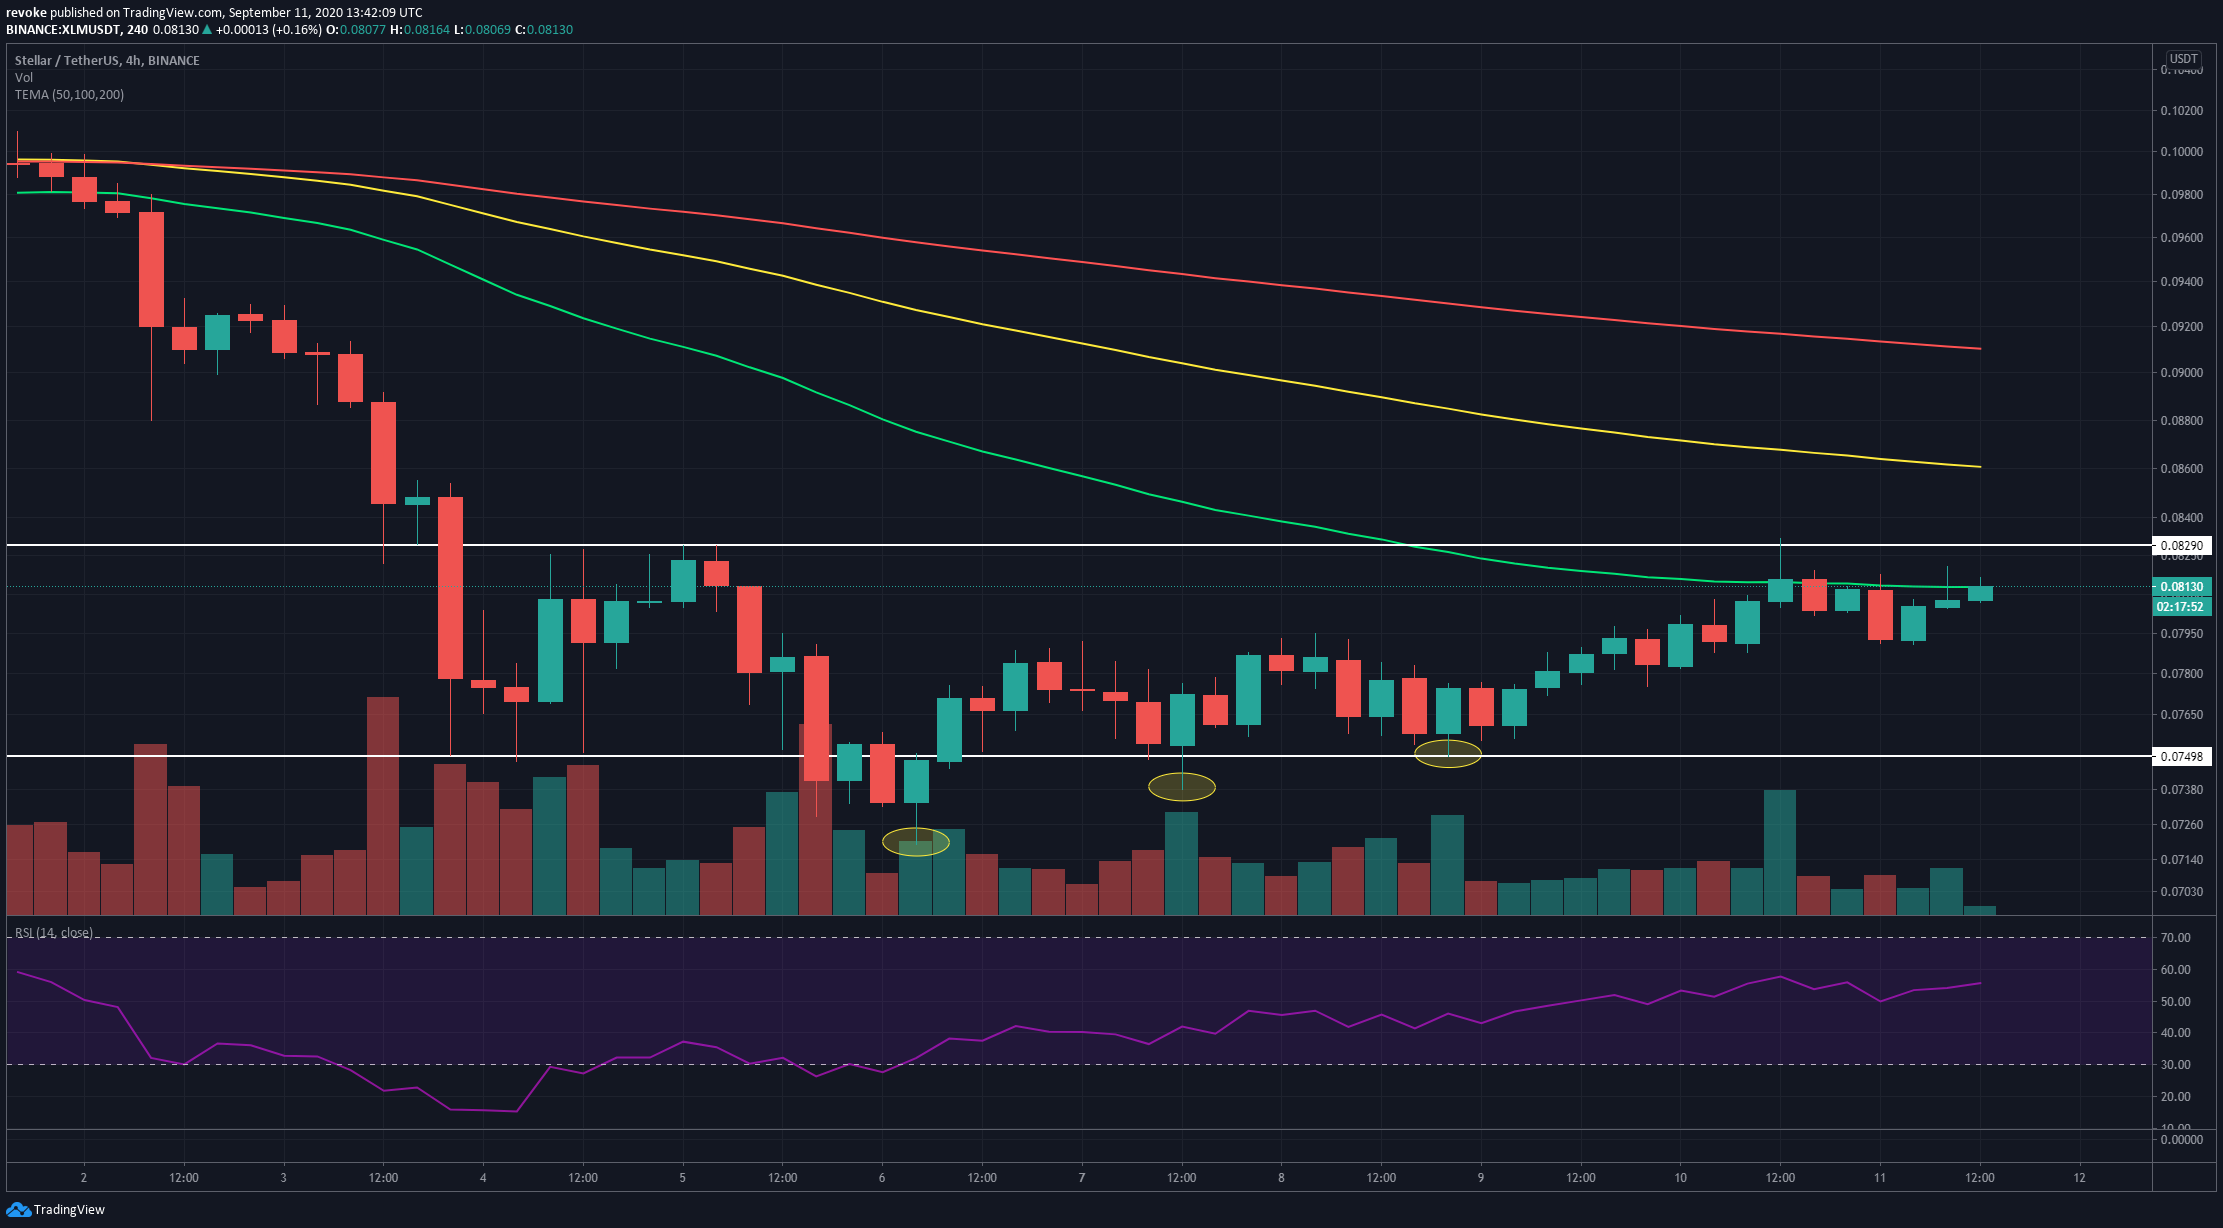
We know the XLM bounce is real because the 4-hour chart favors the bulls, which have created an uptrend. After setting several higher lows, the price of XLM was rejected from $0.082, the next most crucial resistance level. The 50-MA is also acting as a strong resistance point.
If the rejection is stronger, XLM price could drop towards the last low at $0.074 before another leg up.
