- XLM/USD hits a barrier at $0.22 and slides under $0.2, triggering a rise in sell orders.
- Stellar bulls are sweating in the hunt for higher and formidable support to avoid losses towards $0.88.
Stellar has rallied by 200% in November alone, achieving a monthly peak of $0.219. The remarkable growth followed the bullish cycle across the cryptocurrency market. Meanwhile, a massive correction seems imminent, now that the price has dropped under $0.2.
Stellar Lumens starts to retrace on hitting key barrier
Stellar bulls are working around the clock to establish higher support after hitting a wall slightly under $0.22. This impressive liftoff occurred after XLM broke above a descending triangle pattern’s hypotenuse. Trading below $0.22 appears to have triggered more selling pressure and encouraged more sellers to join the market.
XLM/USD is exchanging hands at $0.19, while the immediate downside seems unsupported. The most formidable support area lies at $0.12 (August 2020 peak). If the price overshoots this zone, Stellar would be at risk of erasing all the progress made in November.
%20(9)-637418760353837162.png)
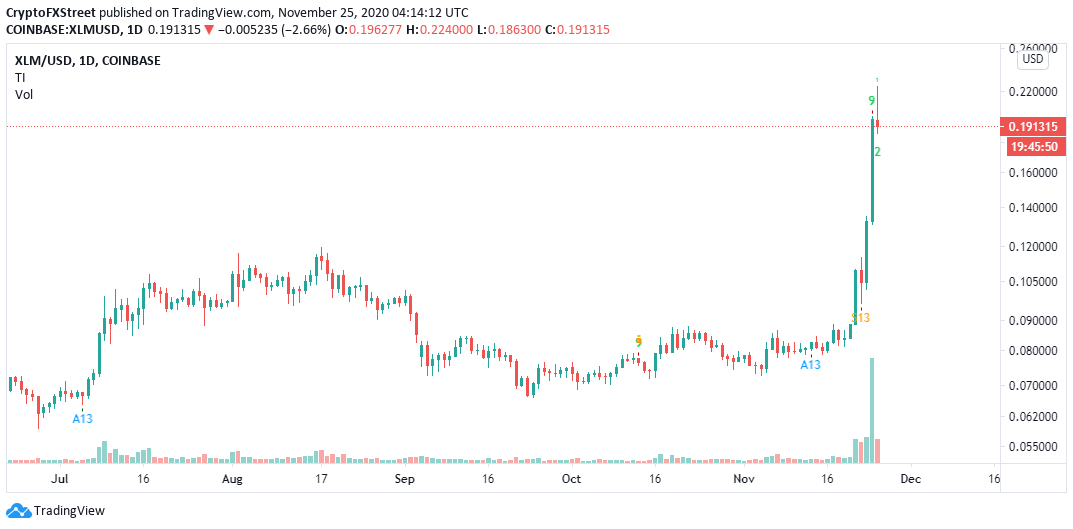
XLM/USD daily chart
The TD Sequential Indicator has given credence to the bearish outlook after presenting a sell signal on the daily chart. The signal was manifested in a green nine candlestick, calling for more sellers to come to the market. If the bearish volume soars, declines may occur in one to four daily candlesticks.
XLM/USD daily chart
The 3-day chart illustrates XLM/USD trading within the confines of an ascending parallel channel. The upper boundary has capped the cryptoasset’s immediate upside. Therefore, closing the day above this barrier might elevate Stellar to higher highs, probably $0.3.
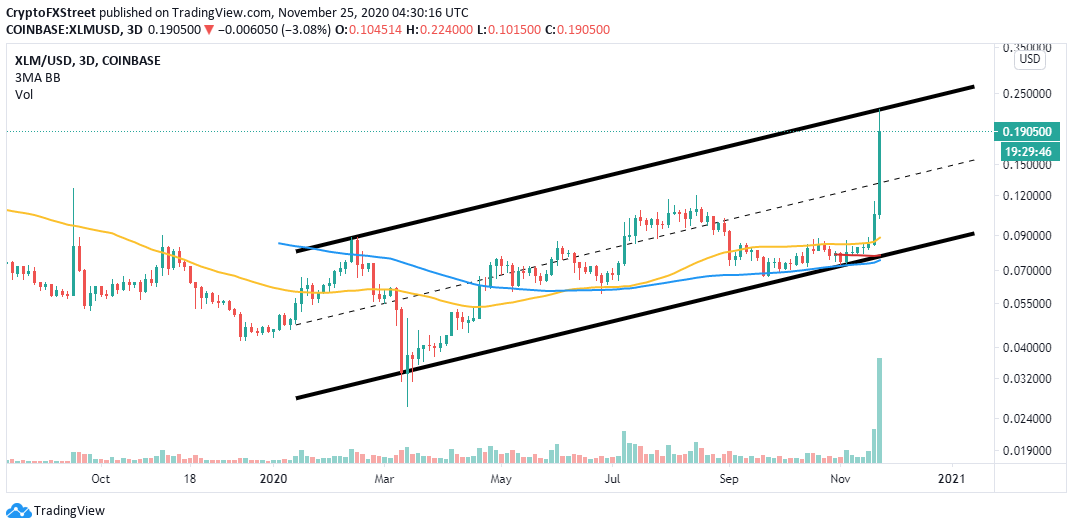
XLM/USD 3-day chart
On the downside, defending the channel’s middle boundary might help avert potential losses to the 100 Simple Moving Average, currently at $0.88. Similarly, if the position above $0.2 is reclaimed, Stellar may renew the uptrend, pushing to a new monthly peak.
