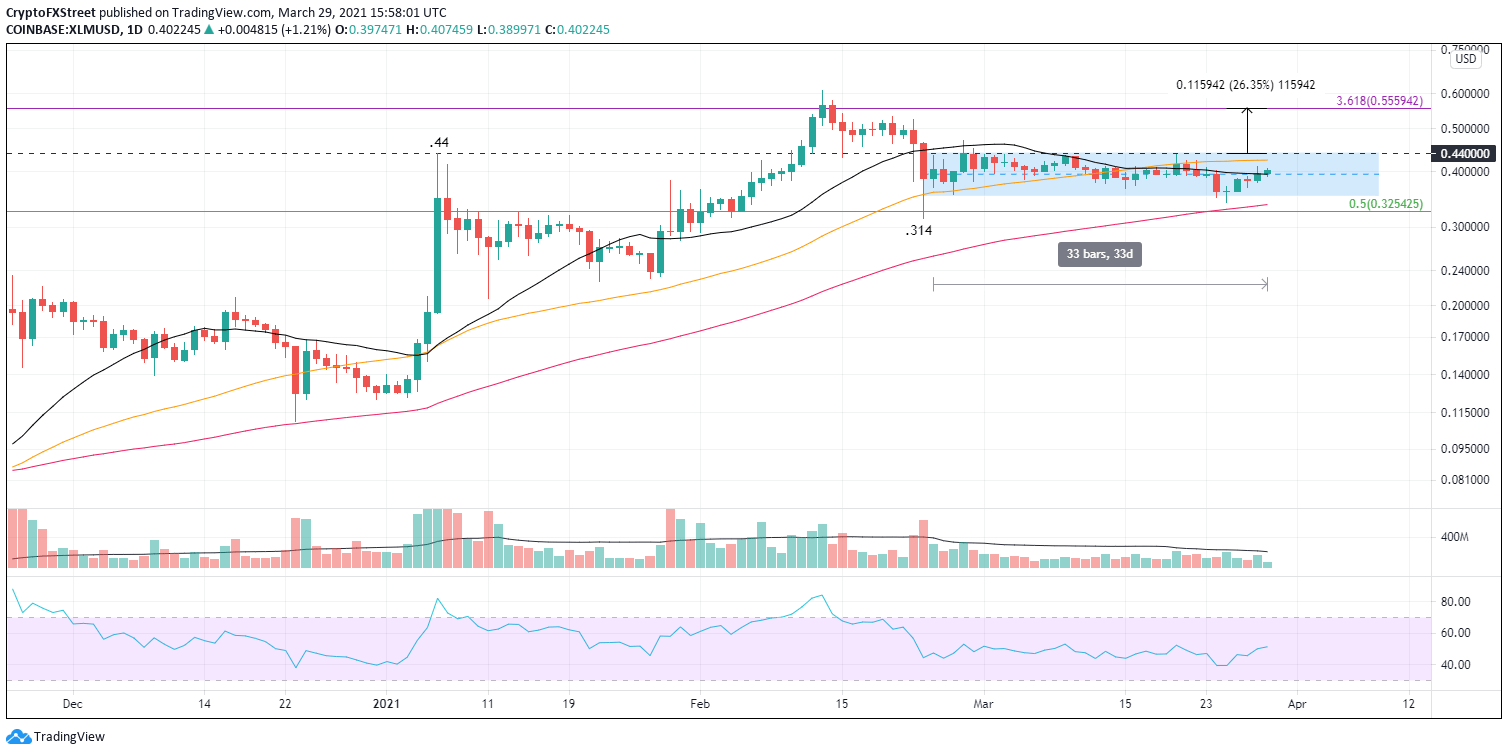
Stellar price closed Sunday with a weekly hammer pattern. Long-term moving averages on the daily chart remain in uptrends. XLM primed to rise 25% in the coming days. Stellar price has trended sideways for 33 days between $0.440 and $0.350, and on below-average volume on each day. The 8.5% decline on March 24 was exhausted by the 25th, and XLM closed with a hammer pattern on the weekly chart, putting traders on alert that bulls were back in control. Price has since rebounded to the middle of the channel at $0.395. Stellar price/volume profile points to accumulation The cryptocurrency complex experienced increased volatility last week, led by Bitcoin, the bellwether cryptocurrency, but XLM closed the week down only -1.55%. The quick reversal was evidence that shakeouts to or around the low of the channel are being used as accumulation pivots. Moving forward, XLM needs to close above the high of the Hammer at $0.425 to confirm the reversal. The $0.425 price level corresponds very closely with the 50-day simple moving average (SMA). A breakout from this price level will put the channel resistance at $0.440 in play. A breakout from the channel presents a price vacuum to the 3.618 Fibonacci extension of the May 19-May 2020 bear market at $0.555, a gain of over 25%. XLM/USD daily chart Stellar price support begins at $0.350, followed by the 100-day SMA at $0.338, and then the February low at $0.314. If none of the levels halt price weakness, XLM is exposed to a more significant decline, taking the altcoin to the January lows around $0.230. FX Street FX Street FXStreet is the leading independent portal dedicated to the Foreign Exchange (Forex) market. It was launched in 2000 and the portal has always been proud of their unyielding commitment to provide objective and unbiased information, to enable their users to take better and more confident decisions. View All Post By FX Street Crypto News share Read Next EUR/USD still stuck below 1.1800, with euro plagued by pandemic concerns FX Street 1 year Stellar price closed Sunday with a weekly hammer pattern. Long-term moving averages on the daily chart remain in uptrends. XLM primed to rise 25% in the coming days. Stellar price has trended sideways for 33 days between $0.440 and $0.350, and on below-average volume on each day. The 8.5% decline on March 24 was exhausted by the 25th, and XLM closed with a hammer pattern on the weekly chart, putting traders on alert that bulls were back in control. Price has since rebounded to the middle of the channel at $0.395. Stellar price/volume profile points to accumulation The cryptocurrency complex… Regulated Forex Brokers All Brokers Sponsored Brokers Broker Benefits Min Deposit Score Visit Broker 1 $100T&Cs Apply 0% Commission and No stamp DutyRegulated by US,UK & International StockCopy Successfull Traders 9.8 Visit Site FreeBets Reviews$100Your capital is at risk. 2 T&Cs Apply 9.8 Visit Site FreeBets Reviews$100Your capital is at risk. 3 Recommended Broker $100T&Cs Apply No deposit or withdrawal feesTrade major forex pairs such as EUR/USD with leverage up to 30:1 and tight spreads of 0.9 pips Low $100 minimum deposit to open a trading account 9 Visit Site FreeBets ReviewsYour capital is at risk. 4 T&Cs Apply Visit Site FreeBets ReviewsYour capital is at risk. 5 Recommended Broker $0T&Cs Apply Trade gold, silver, and platinum directly against major currenciesUp to 1:500 leverage for forex trading24/5 customer service by phone and email 9 Visit Site FreeBets ReviewsYour capital is at risk.