- Stellar price was bounded inside a symmetrical triangle pattern on the 1-hour chart.
- The breakdown below the pattern is a major bearish indicator for XLM.
XLM was in a consolidation period trading sideways awaiting a clear breakout or breakdown from a symmetrical triangle. It seems that bears won and they are targeting $0.121 as the next price point.
Several indicators turn bearish for Stellar price
On the 1-hour chart, XLM established a symmetrical triangle pattern from which has broke down on December 4 after losing the 100-SMA support level and the 50-SMA which are now resistance points.
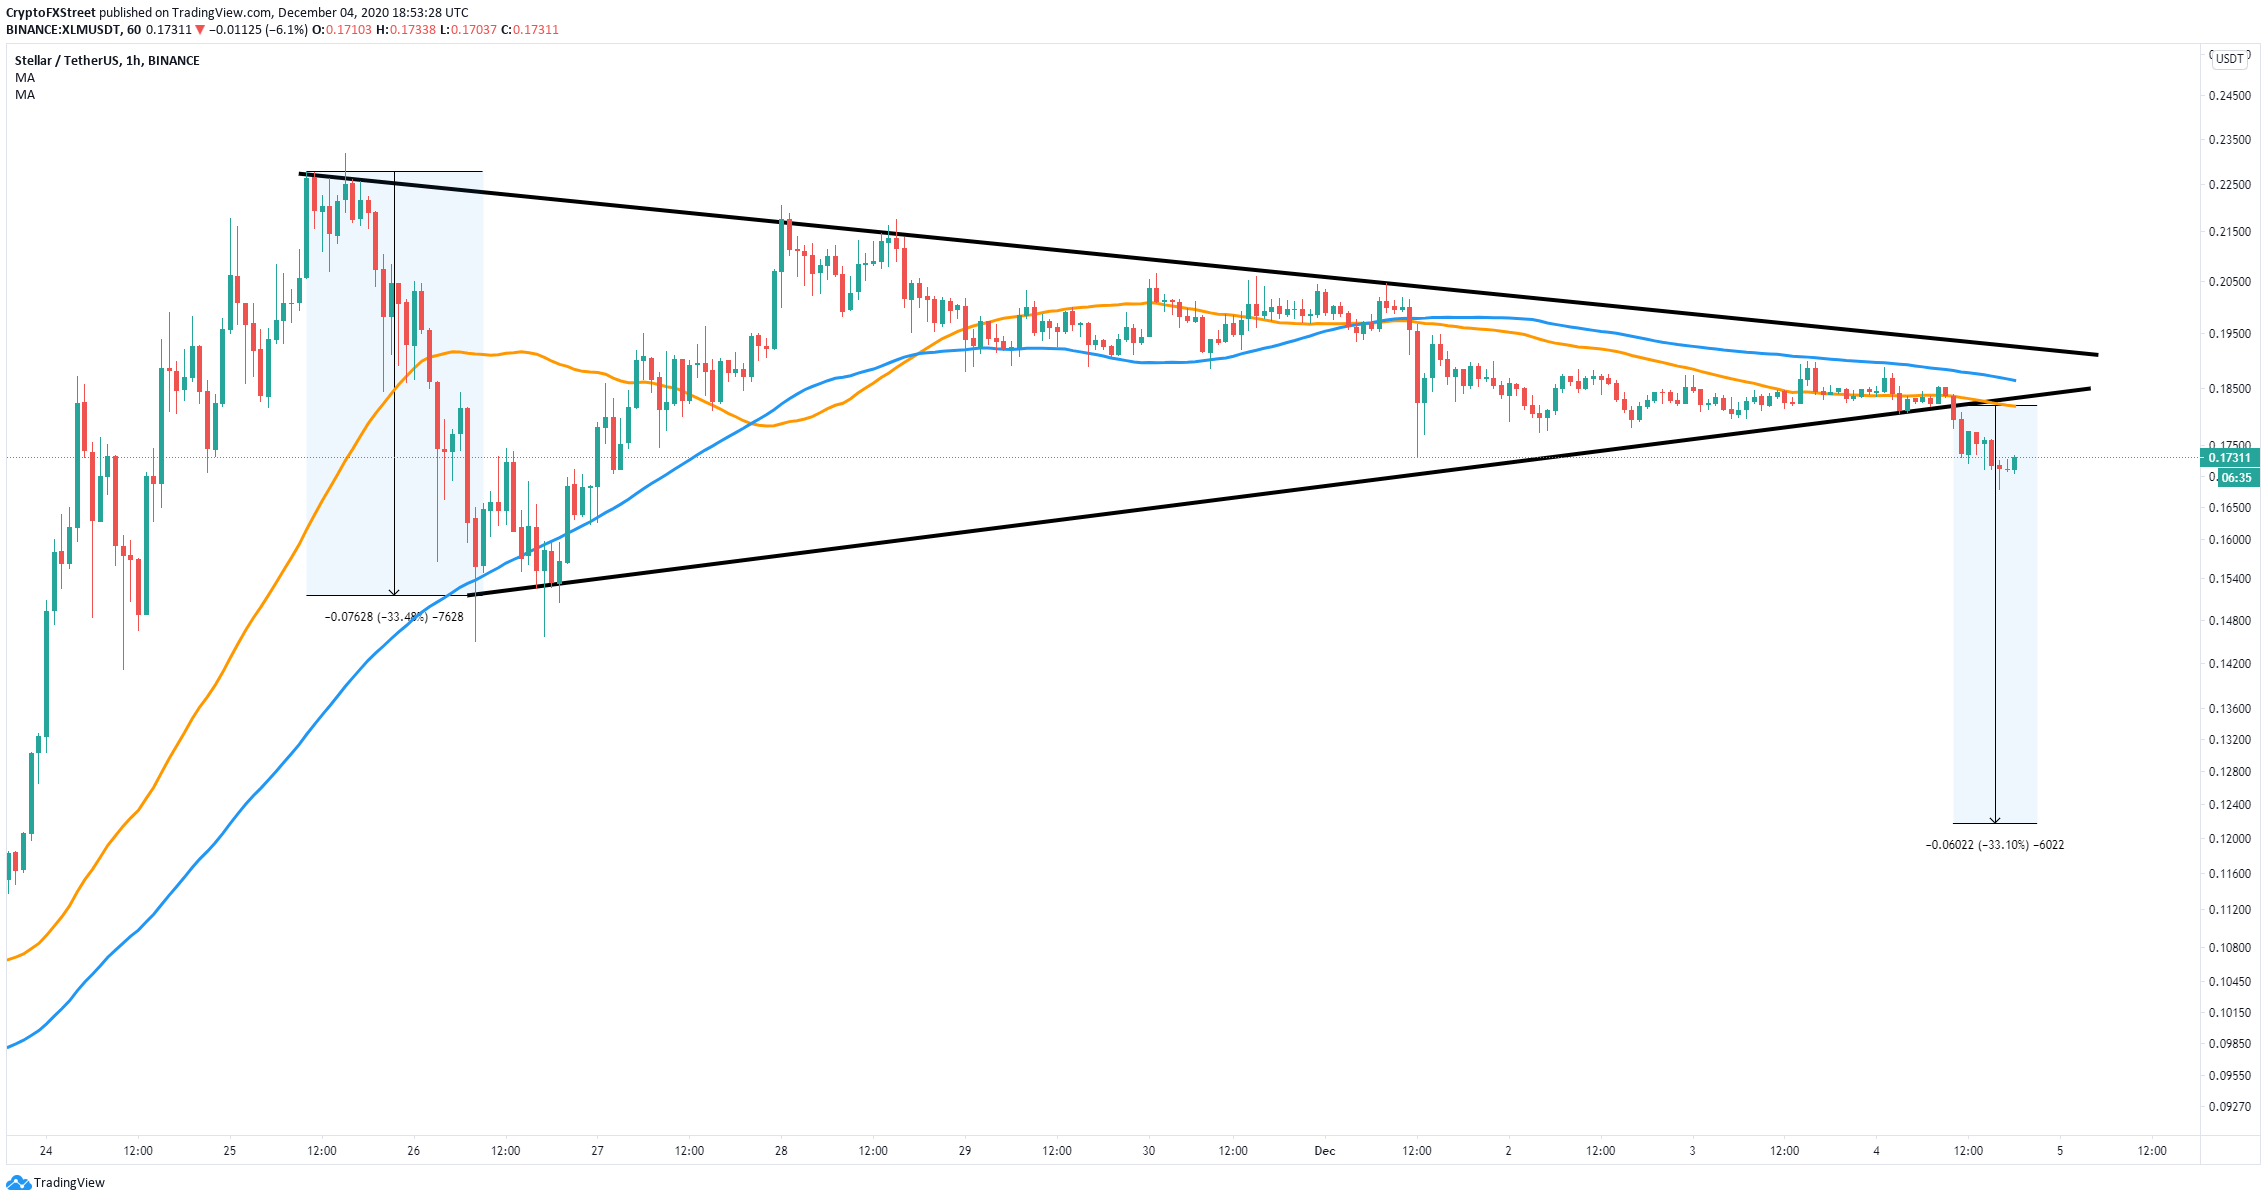
XLM/USD 1-hour chart
Using the height of the pattern as a reference it seems that the long-term price target for the bears will be around $0.121, a 33% nosedive. However, not every indicator is bearish.
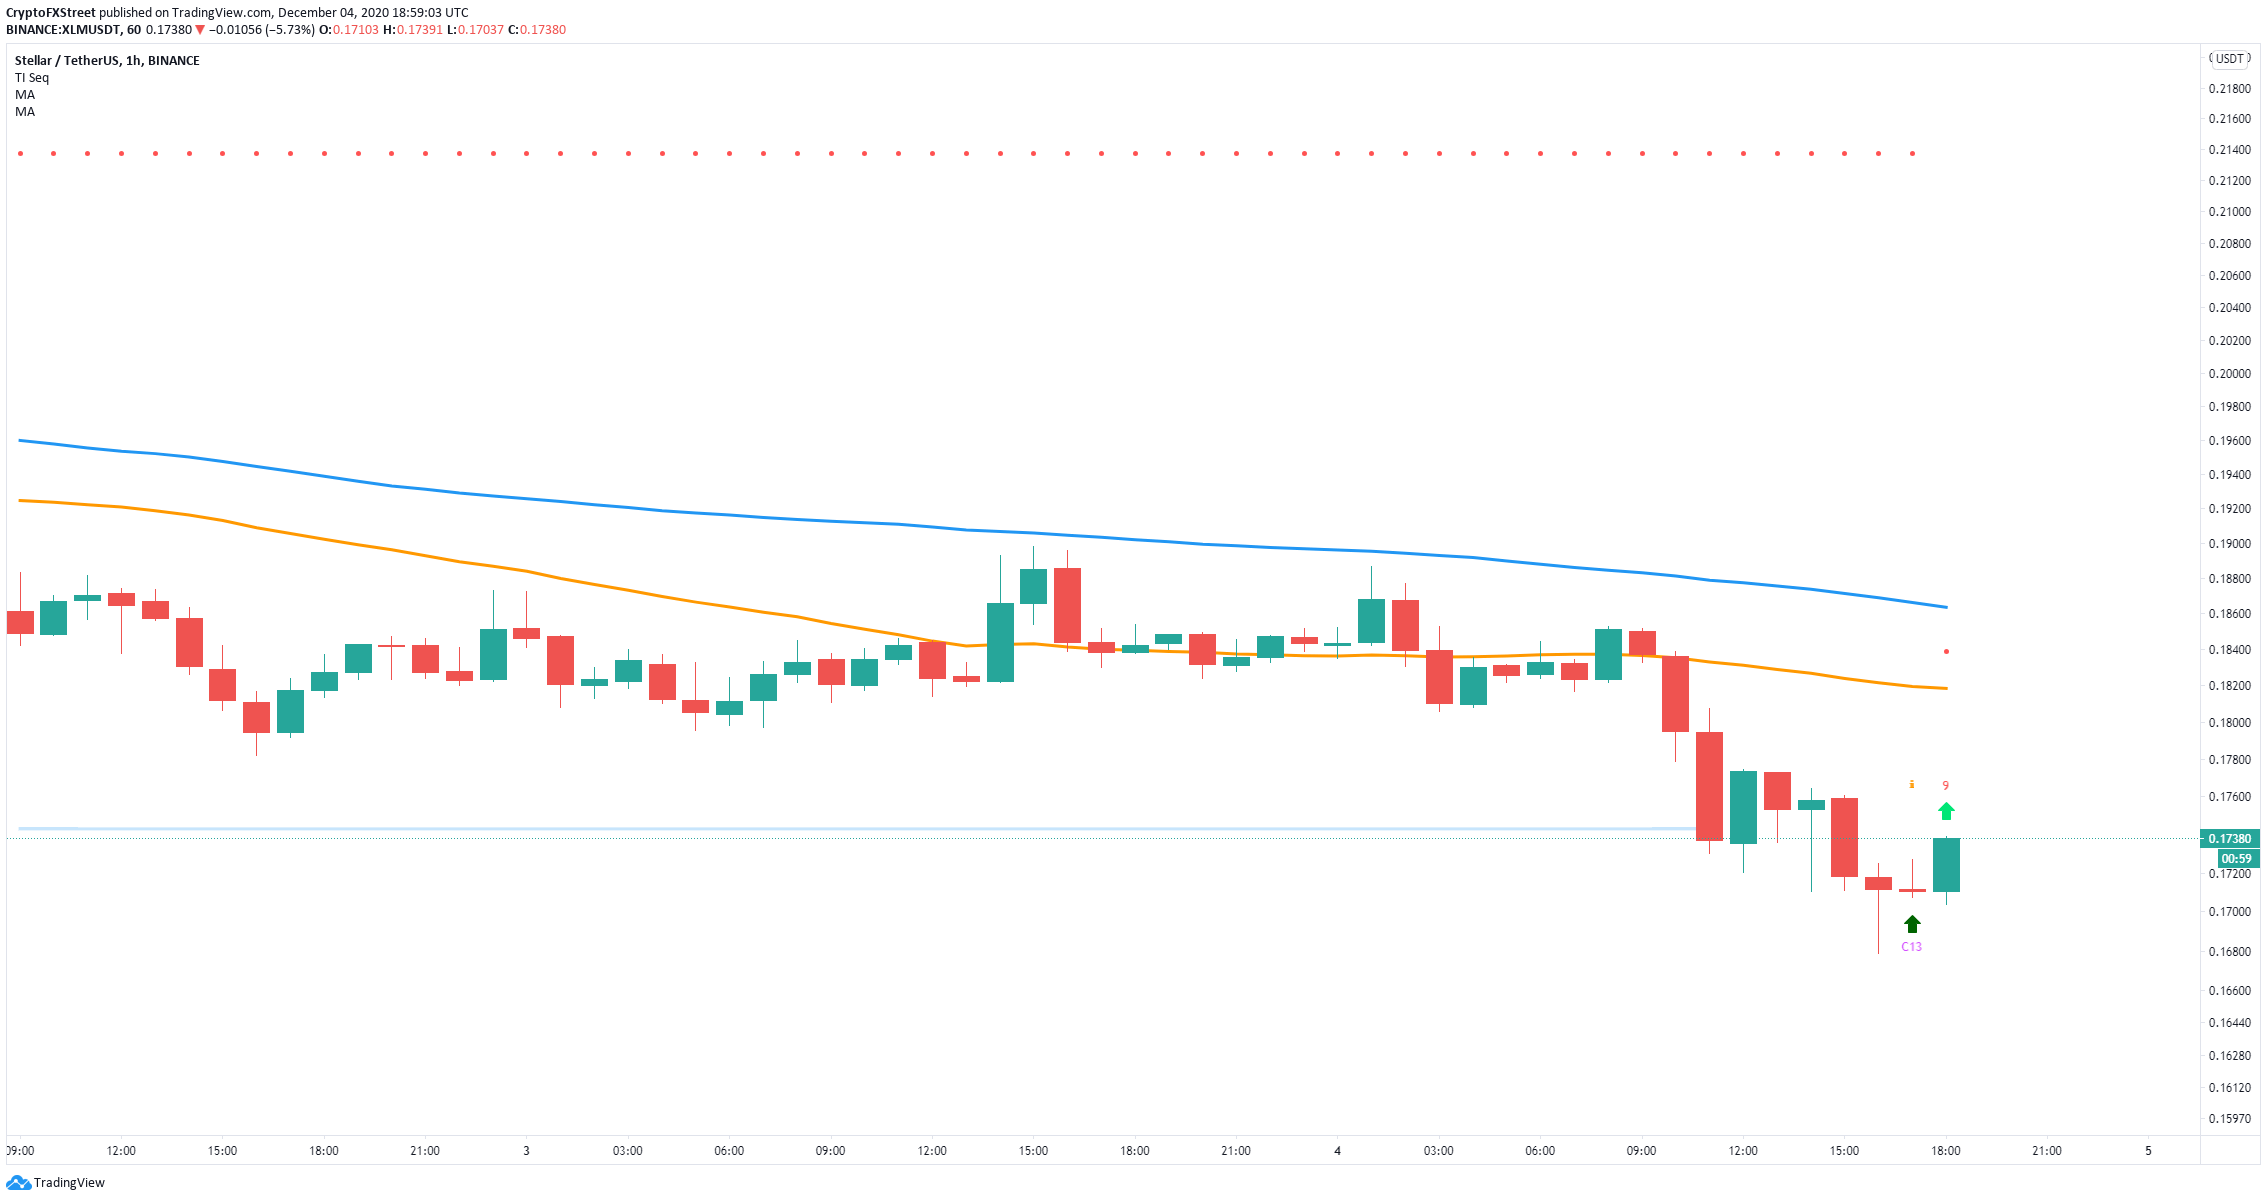
XLM/USD 1-hour chart
For instance, on the same time frame, the TD Sequential indicator has just presented a buy signal. Bulls are targeting the 50-SMA at $0.182 which coincides with the lower trendline of the pattern. After a breakdown, assets tend to re-test the boundary broken.
