- XLM is ready to resume a recovery aiming at $0.22.
- On the downside, $0.165 serves as critical support.
Stellar (XLM) recovered from the recent low of $0.139 hit on December 9 to trade at $0.168 by the time of writing. The coin has stayed mostly unchanged on a day-to-day basis and has lost 1% on a weekly basis.
Stellar is the 11th largest digital asset with a current market capitalization of $3.6 billion and an average daily trading volume of $695 million. Notably, Stellar’s trading volumes decreased from the recent high of $2 billion.
Technical indicators send bullish signals
On the 4-hour chart, XLM broke above the sloping trend line. If $0.165 is verified as a support, the recovery may extend with the next focus on $0.18. This local resistance stopped the upside momentum in December and now it is reinforced by the 4-hour EMA100. A sustainable move above this area will open up the way to the psychological $0.2.
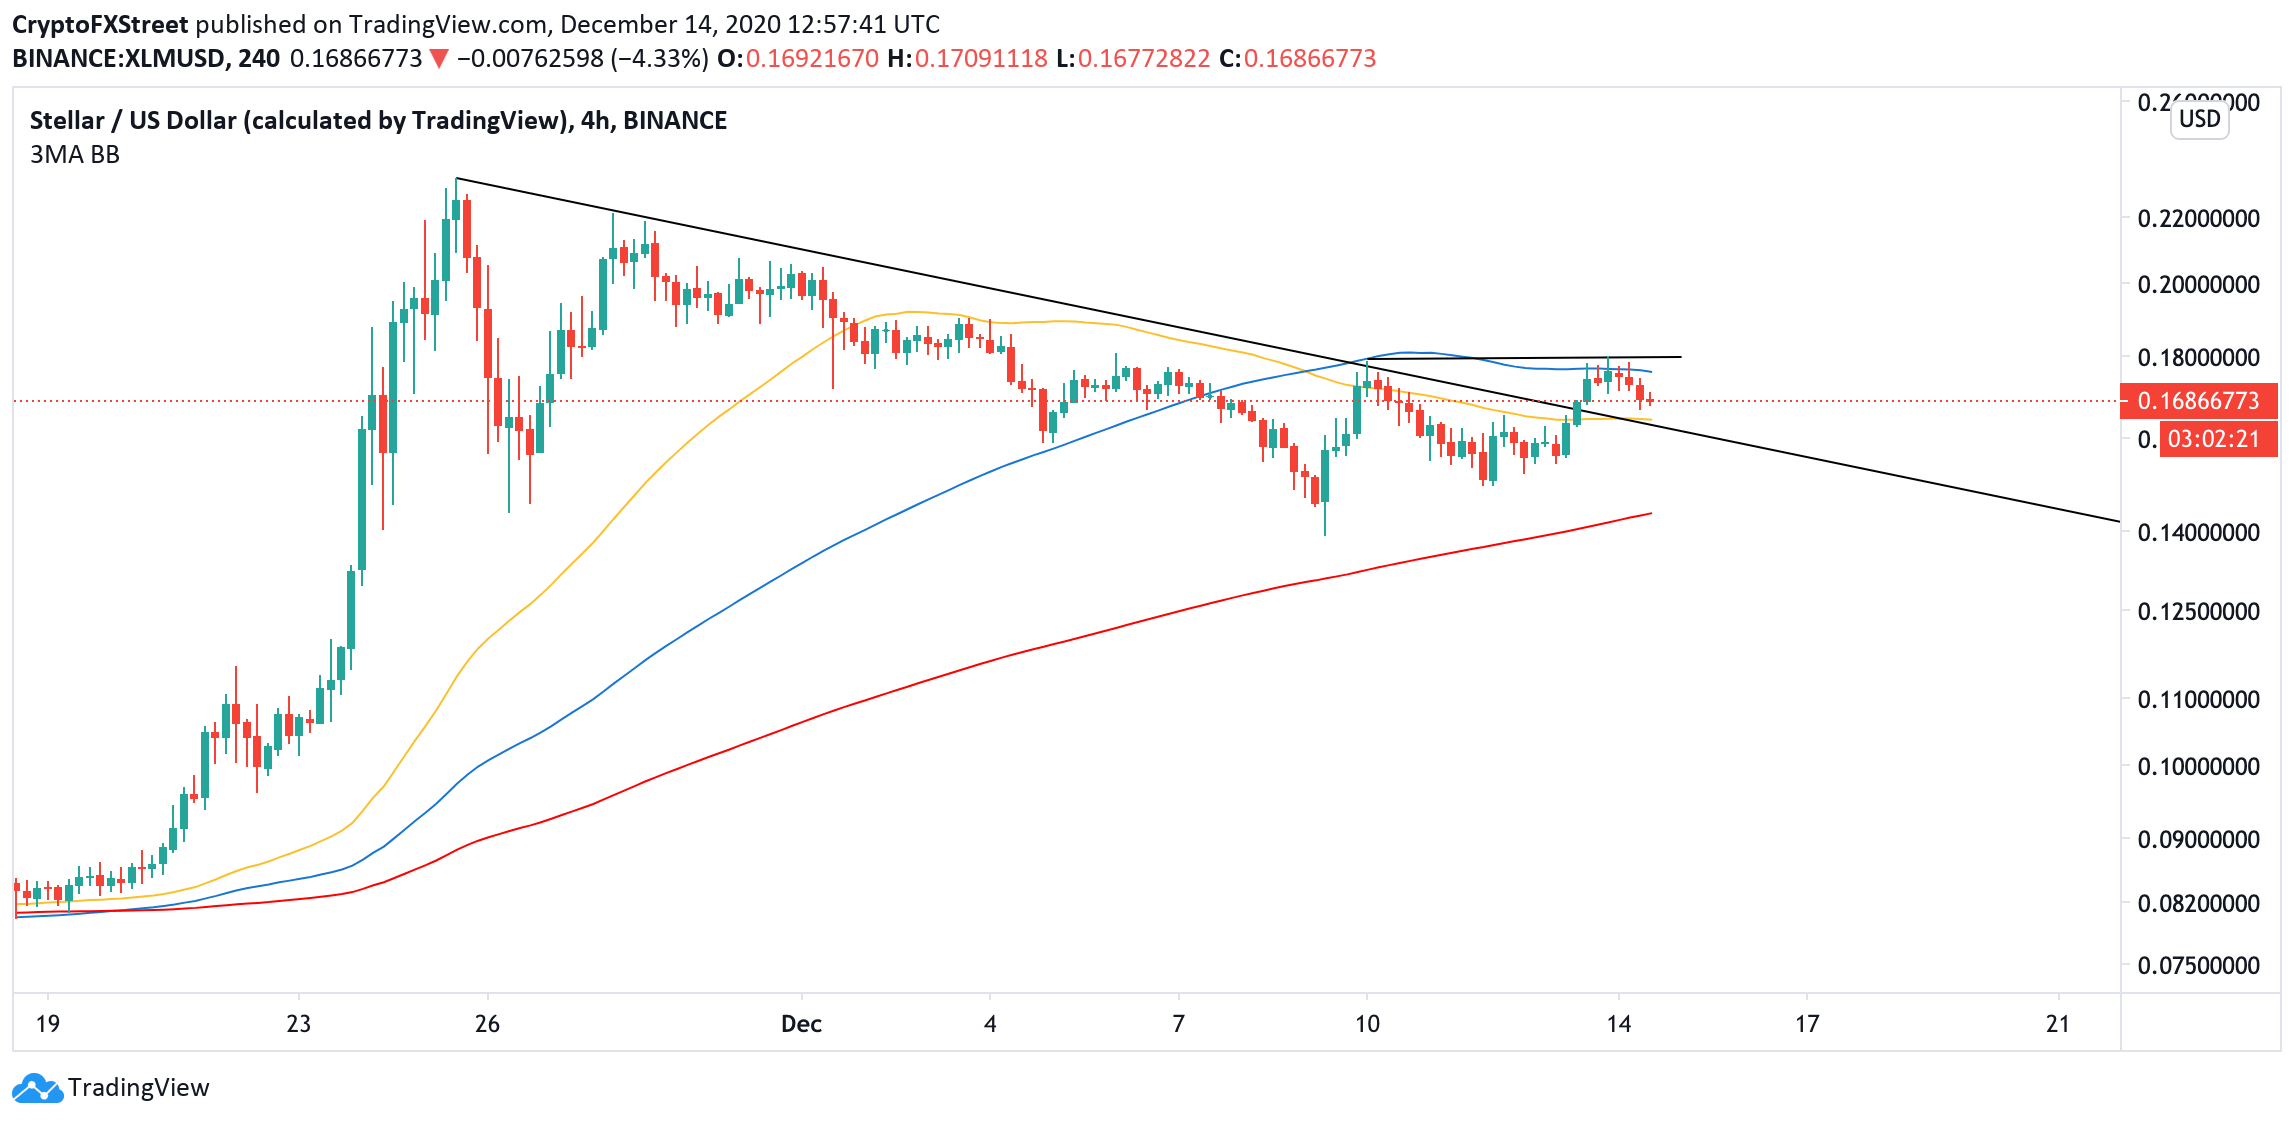
XLM 4-hour chart
Downwards, the above-mentioned trend line coincides with the 4-hour EMA50 at $0.165. If it gives way, the sell-off will gain traction with the next bearish target at $0.14 and the EMA200 located on approach.
The longer-term picture confirms the importance of $0.165 with the 12-hour EMA50. It is followed by a horizontal support line at $0.15, which is a part of a descending triangle pattern.
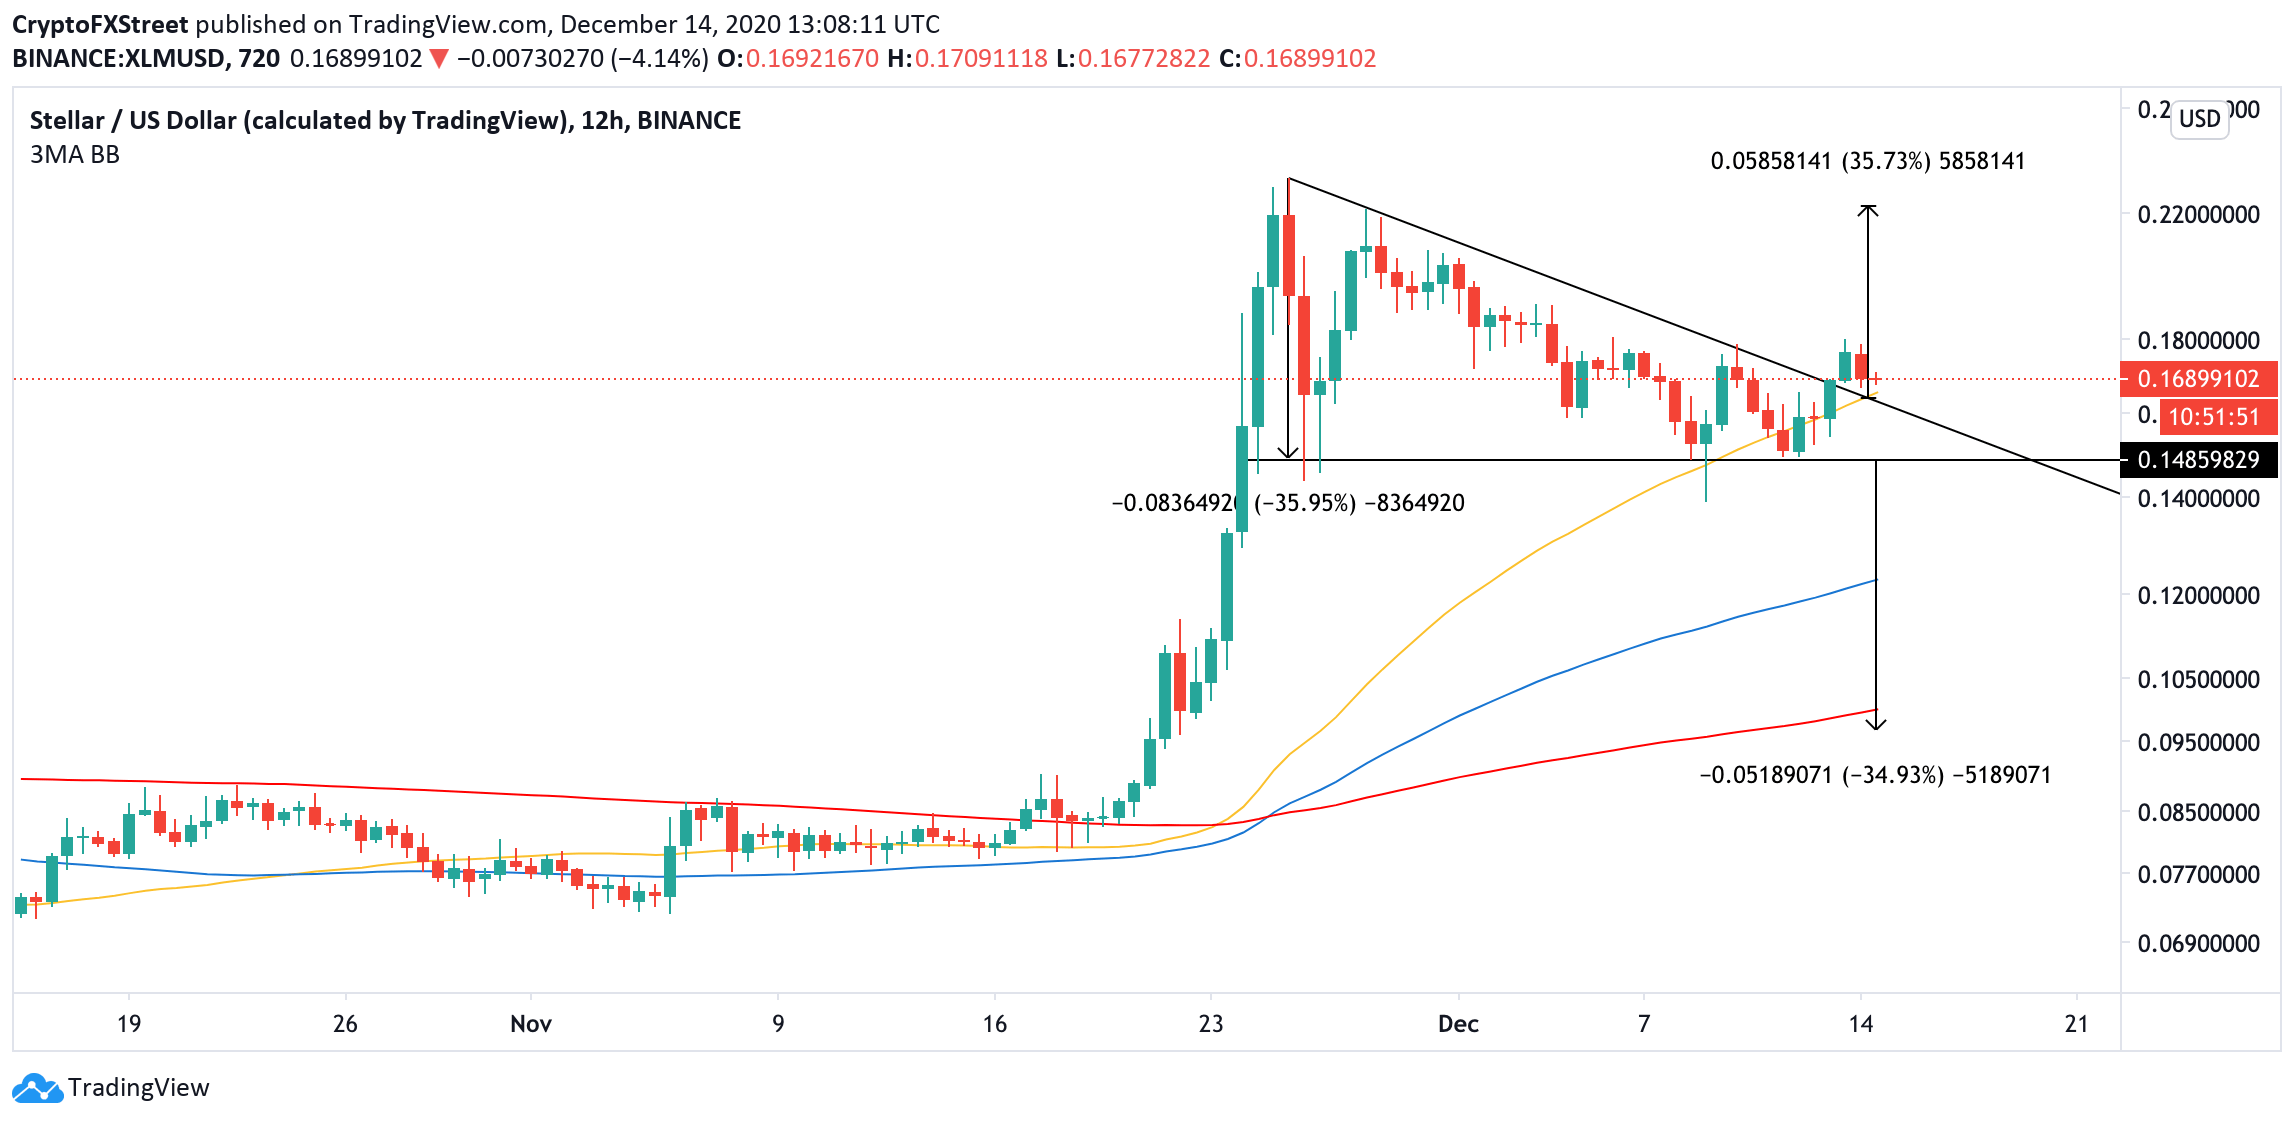
XLM 12-hour chart
This formation is regarded as a bearish signal as the breakdown below the horizontal support may lead to a significant 35% decline further than $0.1. On the other hand, if the bullish breakthrough is confirmed, XLM may extend the recovery with the ultimate goal at $0.22.
