- XLM is trading at $0.072 holding a critical level in the form of the 100-SMA on the daily chart
- Stellar is down more than 60% from its peak at $0.1194.
XLM had a great 2020, from a low at $0.026 on March 12, to a peak at $0.1194. Bulls need to defend a critical support level in order to avoid further losses.
XLM/USD 3-day chart
-637376978736645026.png)
The 100-SMA at $0.069 is the most important support level. It was defended twice on September 21 and 30. A bearish breakout below this level would take the digital asset down to $0.06.
XLM/USD daily chart
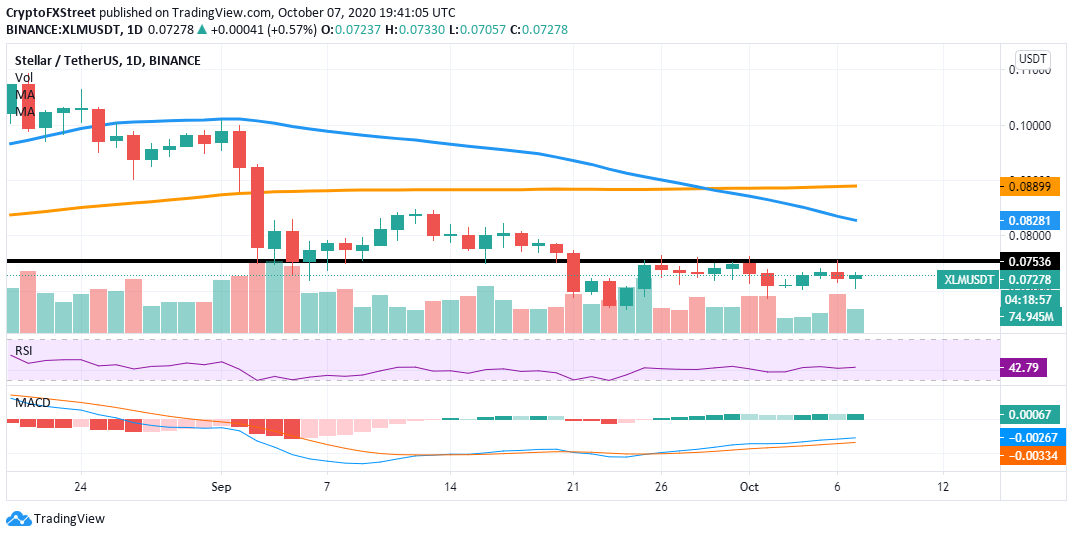
XLM is facing a resistance level at $0.075 that has rejected the price several times during the past two weeks. The 50-SMA and the 100-SMA have crossed bearishly and will act as resistance levels.
The Bollinger bands are squeezing, which indicates a major move is underway, so far favoring the bears. Furthermore, the 1-hour chart is also in favor of the sellers. The TD sequential indicator is close to presenting a sell signal after posting a green ‘8’.
XLM/USD 1-hour chart
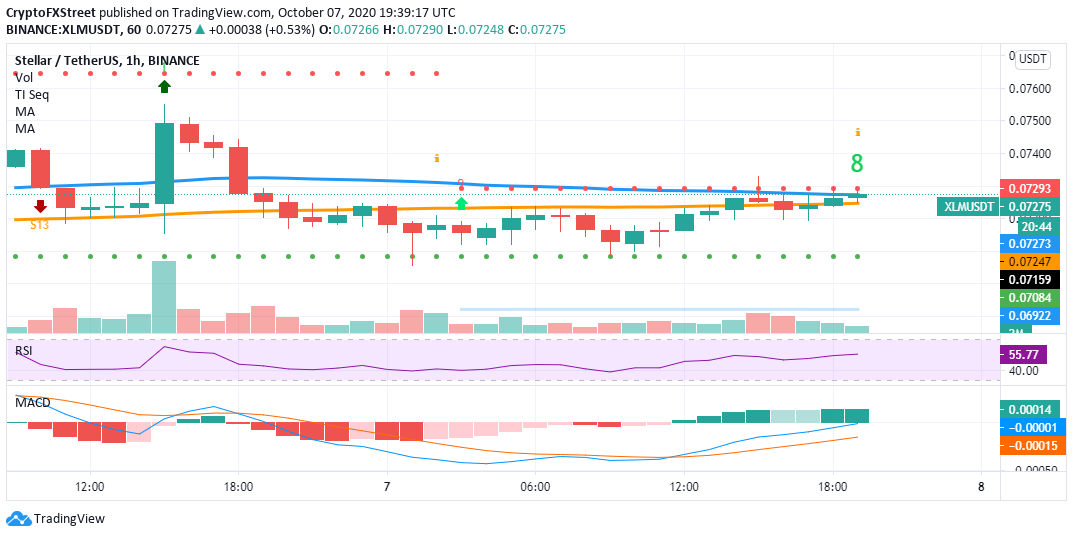
On the other hand, XLM is trading above the 100-SMA and the 50-SMA on the 1-hour chart, turning both into support levels. The MACD has been bullish since this morning and could help the price close above the 50-SMA.
A breakout above the $0.075 resistance level on the daily chart could take XLM up to the 50-SMA at $0.082.
Sellers need to pay close attention to the 100-SMA on the 3-day chart as the most critical support level. A bearish breakout can drop the price towards $0.06.
