- Stellar price is contained inside a symmetrical triangle pattern on the 12-hour chart.
- A key indicator is on the verge of presenting a massive sell signal.
- XLM bulls must defend $0.361 to avoid a colossal sell-off.
Stellar price already had a significant 50% sell-off from its top of $0.60 but the bears could be eying up even more. There is a lot of downside potential for XLM as several indicators show it could be poised for another leg up.
Stellar price needs to defend this key level to avoid a 45% drop
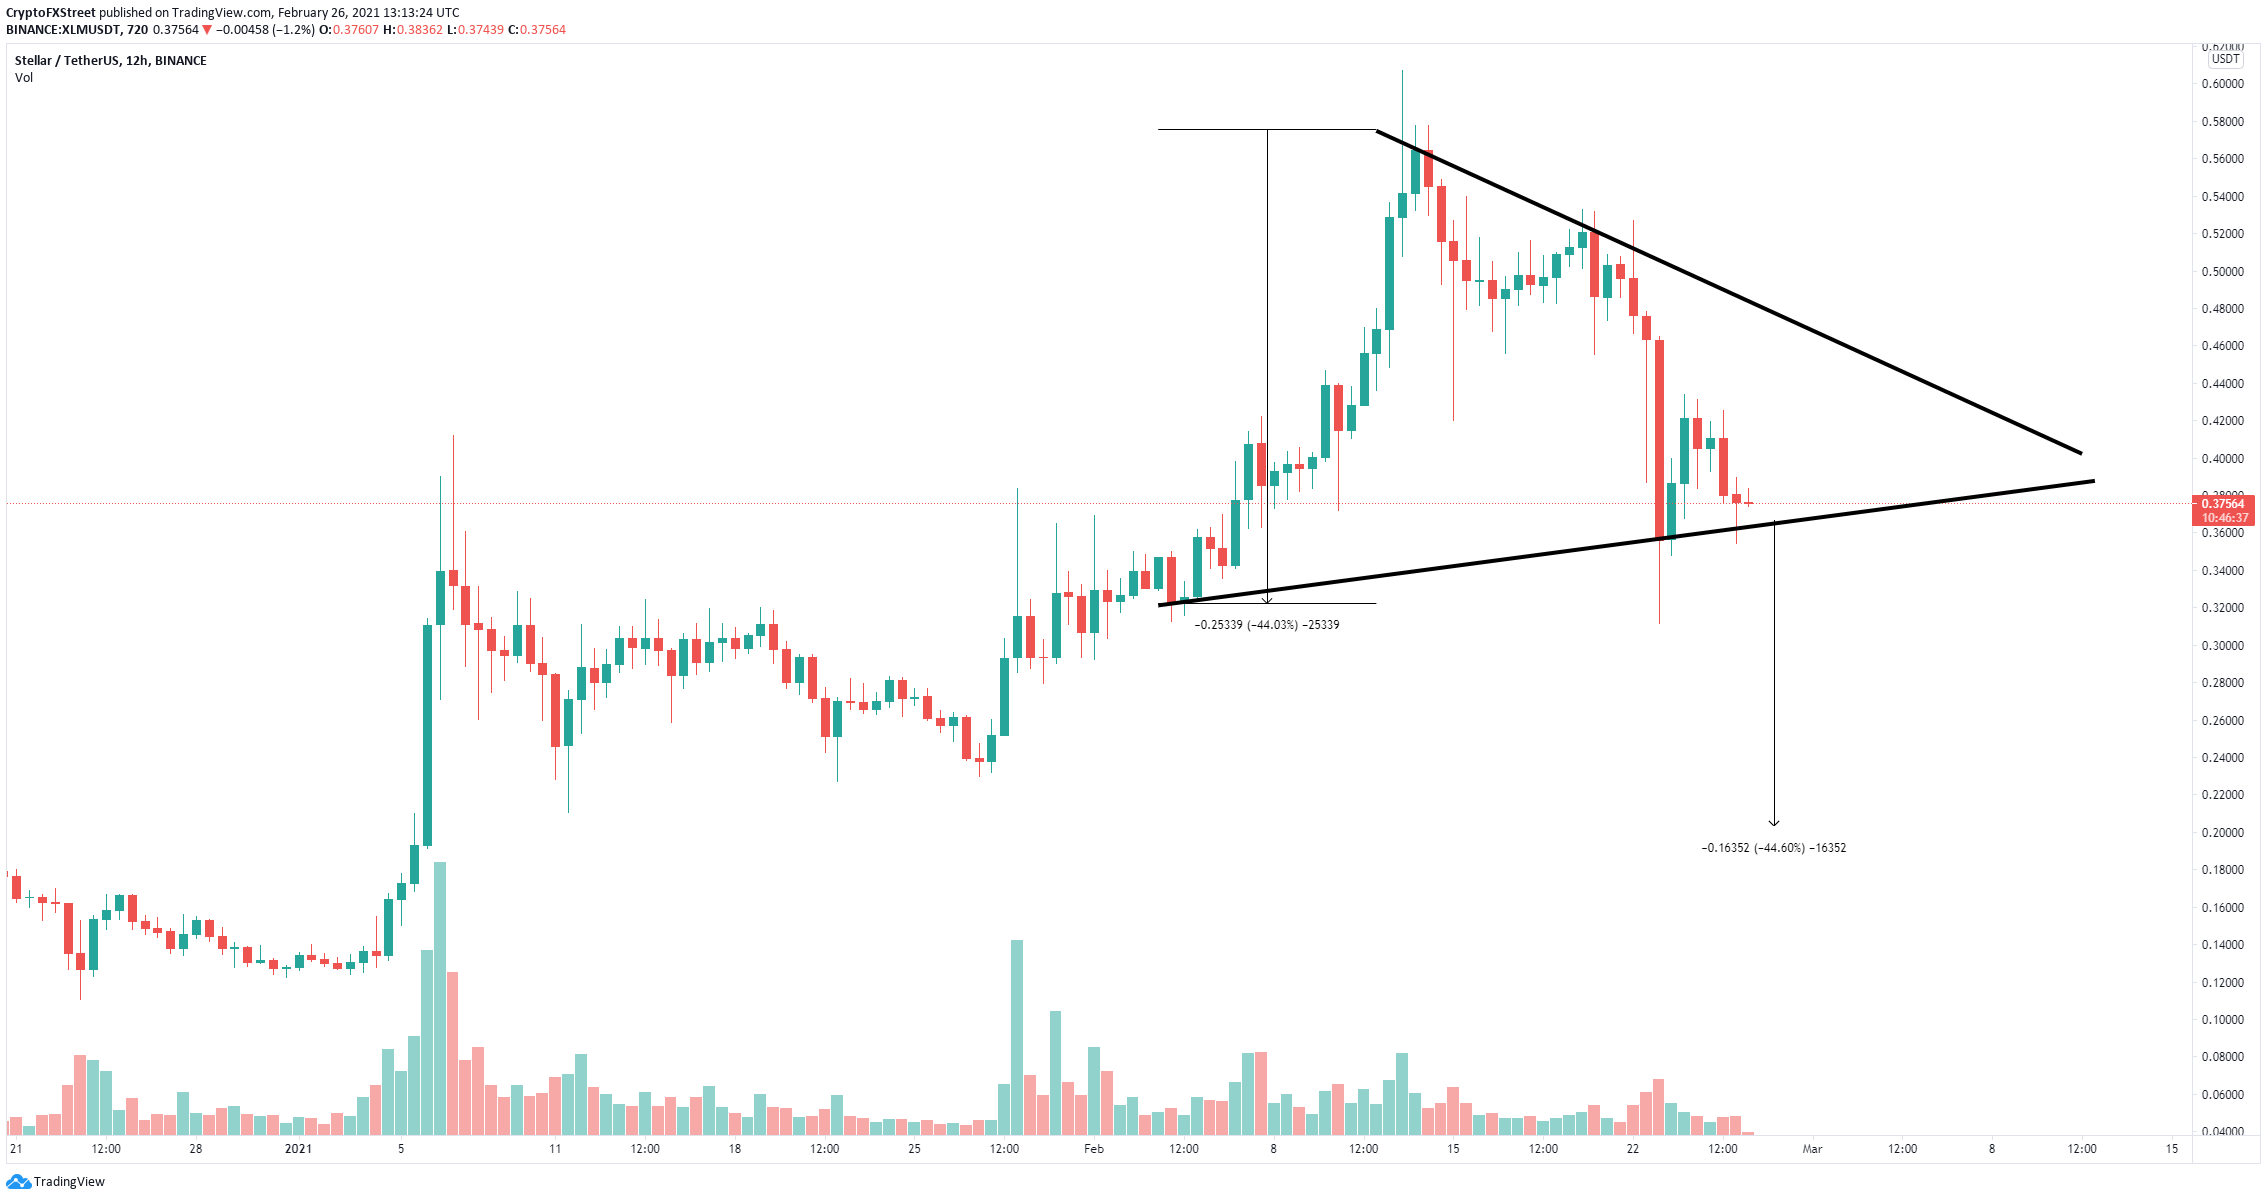
On the 12-hour chart, Stellar has established a symmetrical triangle pattern with a critical support trendline located at $0.361. A breakdown below this point would push Stellar price down to $0.20, a 45% move calculated using the maximum height of the pattern as a reference point.
XLM/USD 12-hour chart
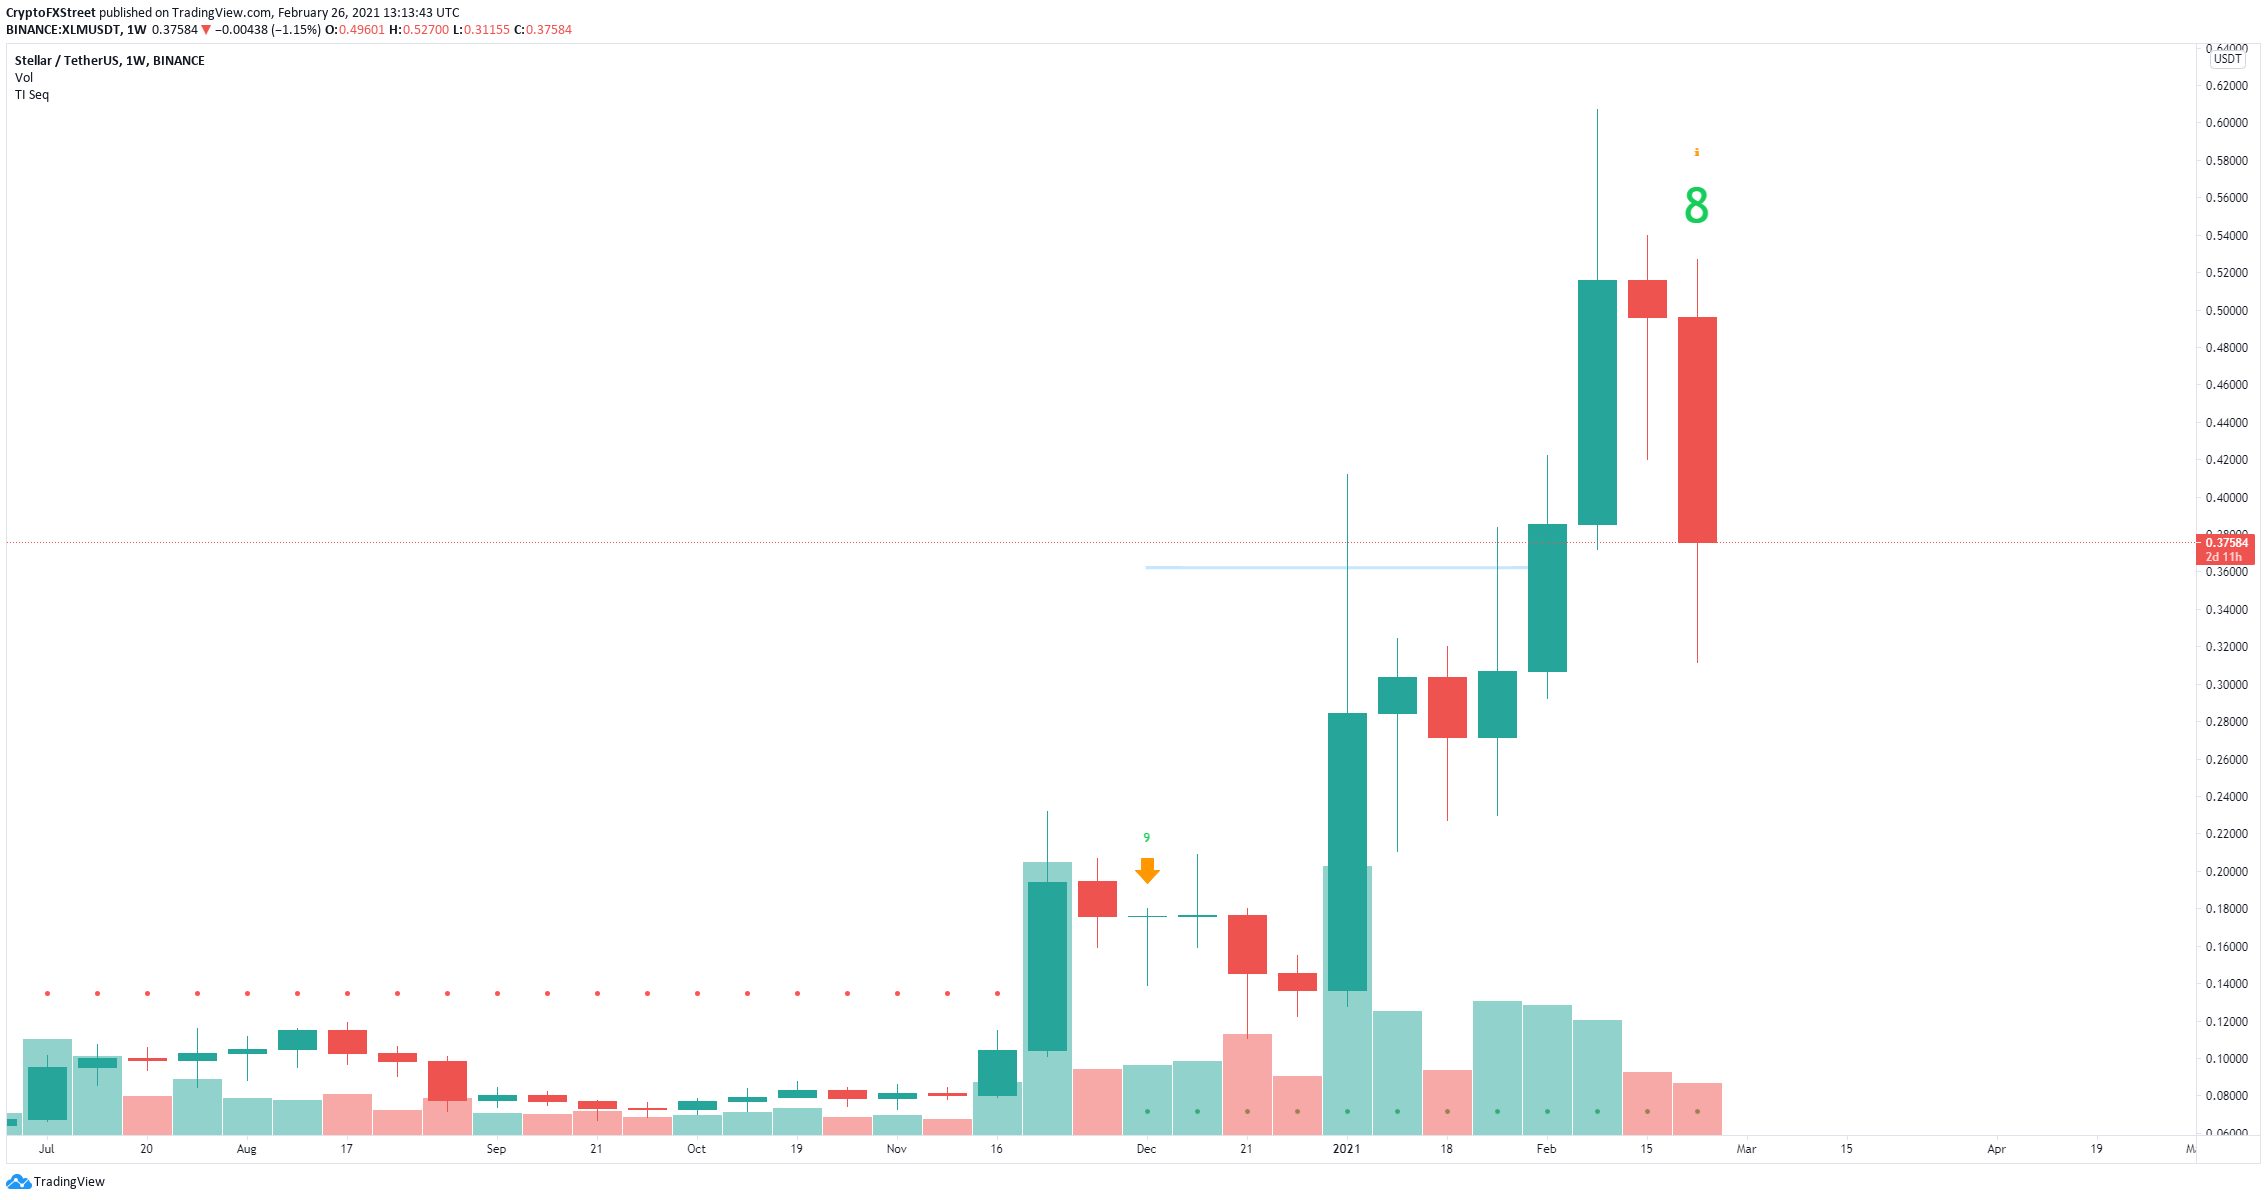
Additionally, the TD Sequential indicator has presented a green ‘8’ candlestick on the weekly chart which is usually followed by a sell signal. This call would be significant considering the last one had a lot of bearish continuation.
XLM/USD weekly chart
On the flip side, if the bulls can defend $0.361, XLM will aim for a nice rebound towards the upper trendline of the symmetrical triangle at around $0.47.


