- XLM/USD spots a potential bull pennant on the daily chart.
- RSI points north while within the bullish region.
- Upside appears more compelling for Stellar Lumens.
Stellar Lumens (XLM/USD) trades within last week’s range on Sunday, as the bulls await a strong impetus for the next move northwards.
The all-time highs at $0.6123 are back on the buyers’ radars, with the short-term technical setup also backing the case for the additional upside.
XLM/USD attempting another run to record highs and beyond
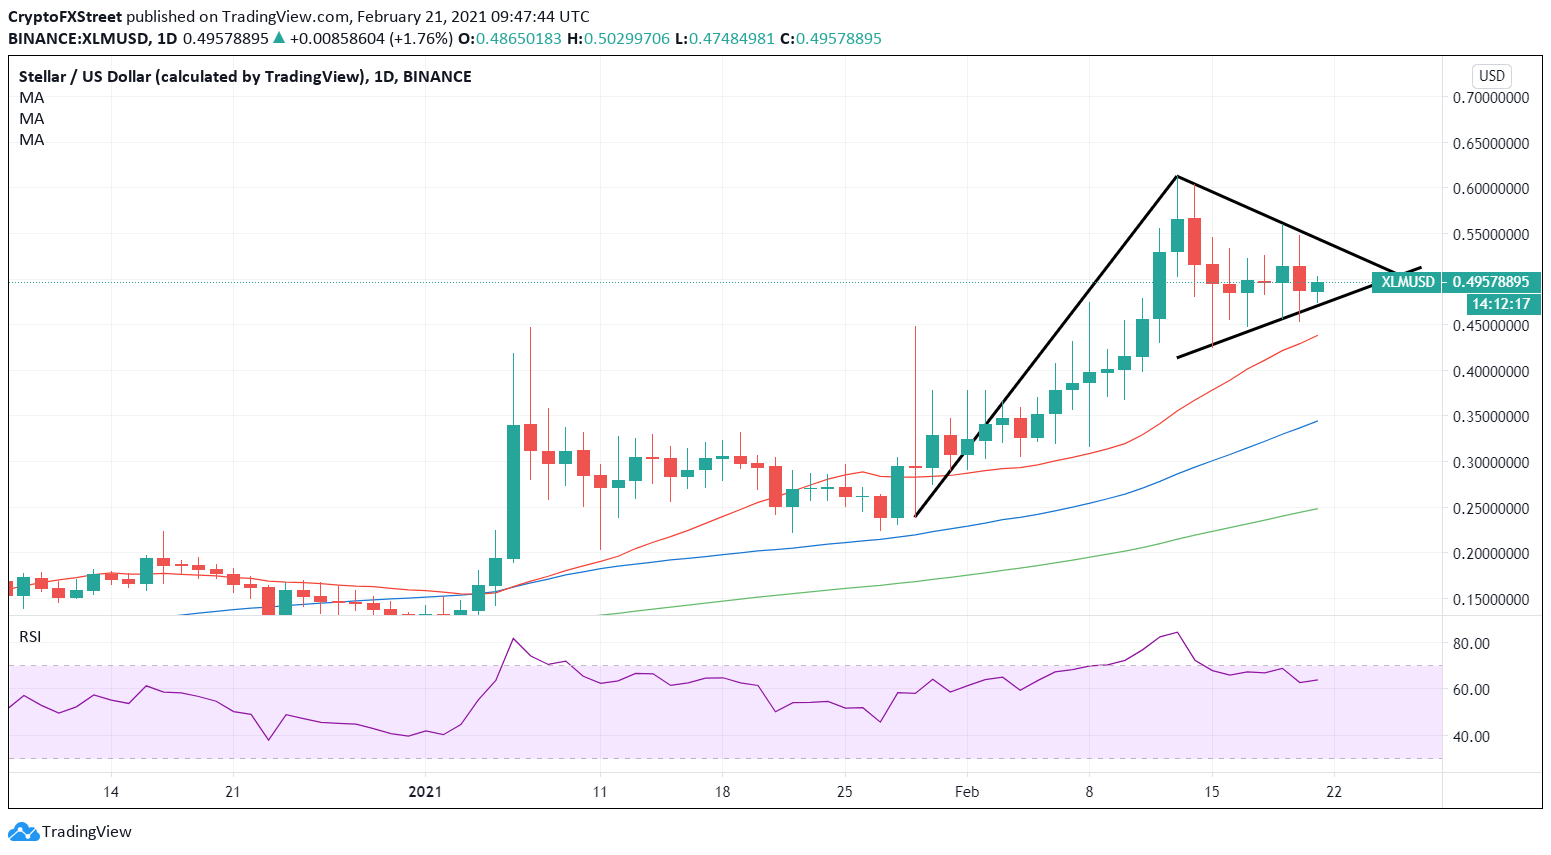
XLM/USD: Daily chart
XLM/USD is eyeing a daily closing above the falling trendline resistance at $0.5425 in order to validate a bull pennant formation.
Adding credence to the upside bias, the 14-day relative strength index (RSI) edges higher above the 50 level.
The bulls will target the $1 psychological level if the record high is taken out.
On the flip side, if the price closes below the rising trendline support at $0.4740 on the daily candlestick, it could lead to the pattern failure, exposing the bullish 21-daily moving average (DMA) at $0.4384.
Further south the upward-sloping 50-DMA at $0.3452 could likely be the last resort for the XLM bulls.
