- Storj price seems to have found support around the 50% Fibonacci retracement level at $2.28.
- A surge in bullish momentum here signals a reversal that could bring about a retest of the all-time high at $3.83.
- Transactional data reveals two critical levels may dampen the upswing pressure.
The Storj price seems to be appreciating as interested investors accumulate but this run-up could quickly end if it fails to overcome two critical supply barriers.
Storj eyes higher high
The Storj price dropped nearly 46% after hitting record levels on March 28. As the bull run cooled off, cryptocurrencies started to retrace, and so did STORJ. This pullback caused the Storj price to shed nearly half of its value.
On March 7, STORJ bounced off the 50% Fibonacci retracement level at $2.28, signifying a potential reversal in play. A short-term confirmation for this will arrive if bulls manage to produce a decisive candlestick close above the 61.8% Fibonacci retracement level at $2.53 on the daily chart.
If the buyers gather steam here, there is a high chance for the Storj price to overcome the 78.6% Fibonacci retracement level at $3.04. Such a move would seal the bullish fate and perhaps even allow for a retest of the all-time high at $3.83.
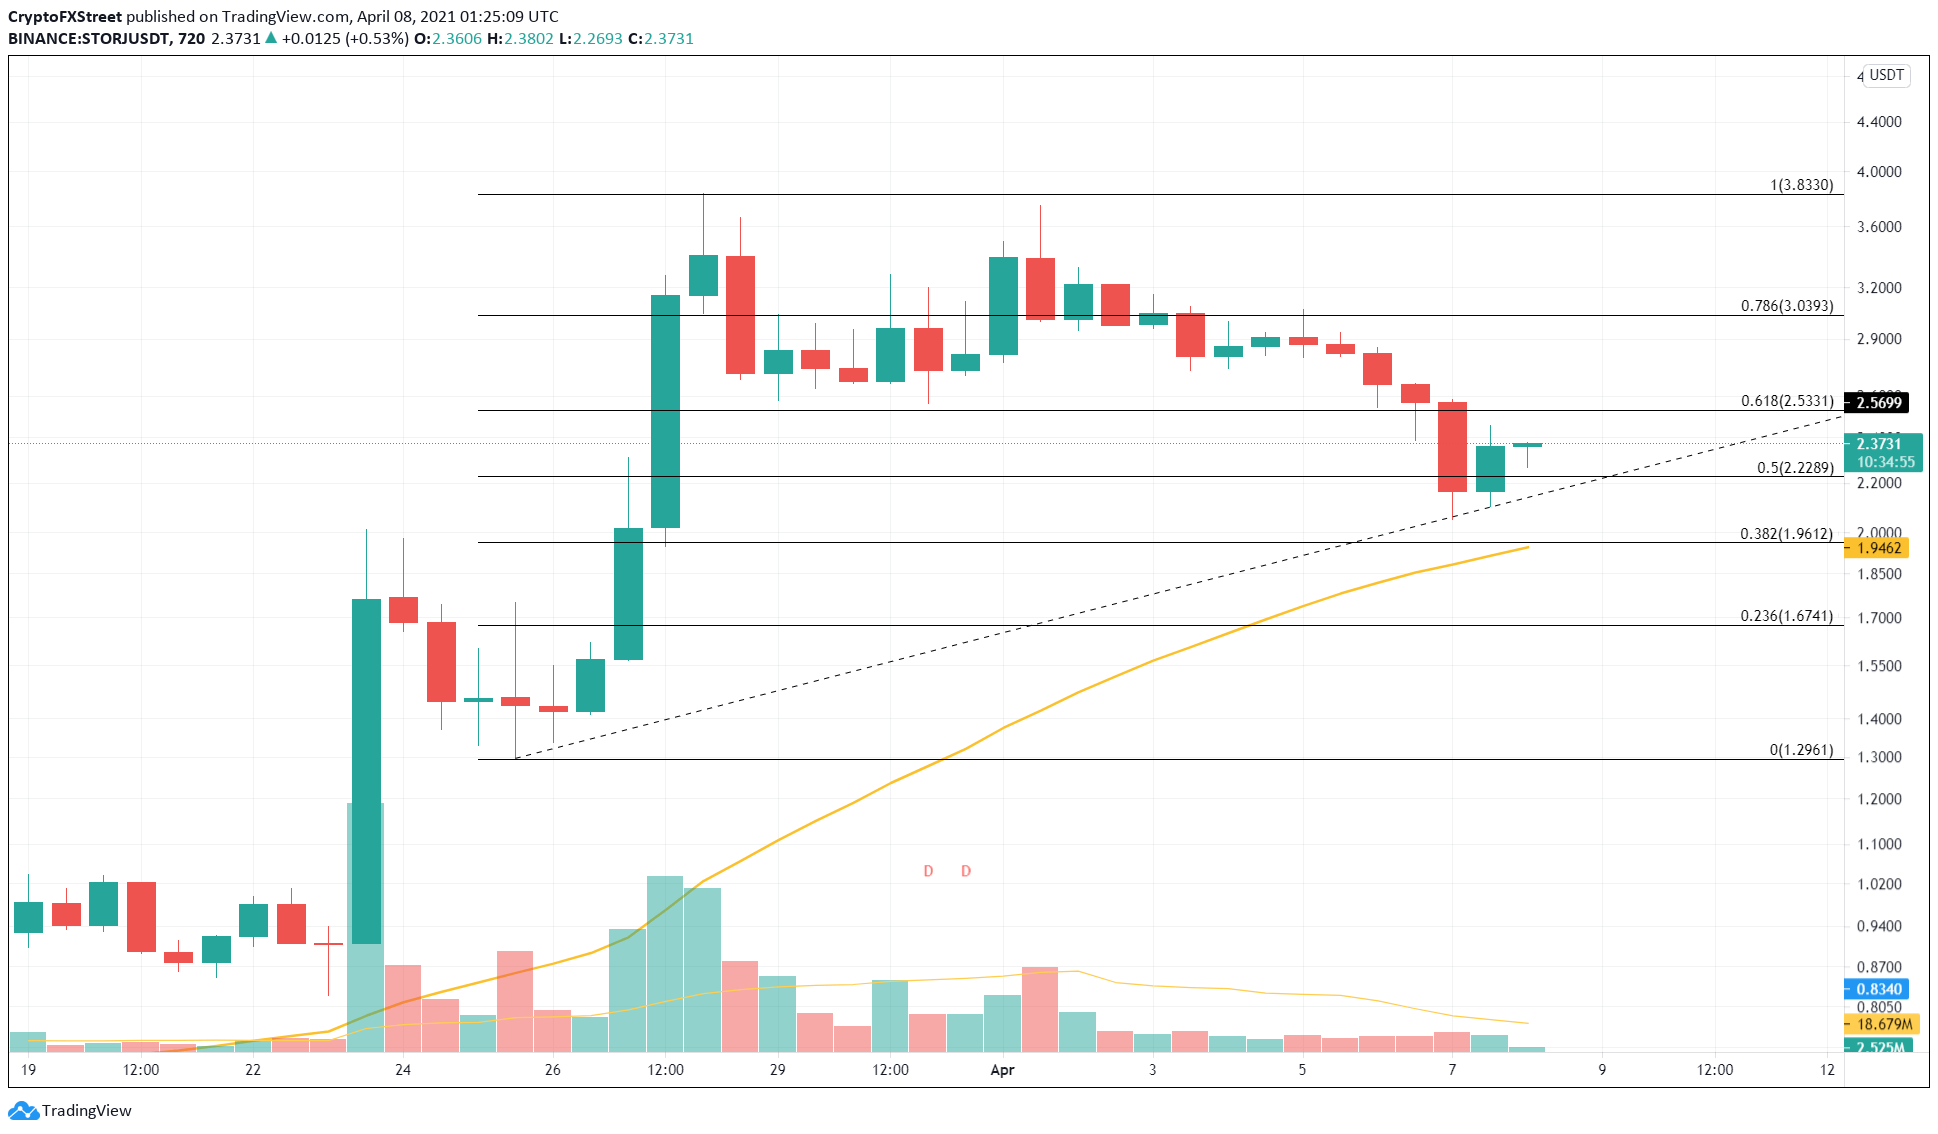
STORJ/USDT 12-hour chart
Portraying STORJ’s uphill battle is IntoTheBlock’s In/Out of the Money Around Price (IOMAP) model. This metric reveals two clusters of “Out of the Money” investors, which could deter the upswing in Storj price.
Around 616 addresses that purchased nearly 11.03 million STORJ tokens at an average price of $2.50 are underwater. Similarly, 570 addresses holding almost 7m STORJ will provide a substantial resistance around the $2.62 level.
Therefore, buyers must clear these levels to have any chances of an upswing.
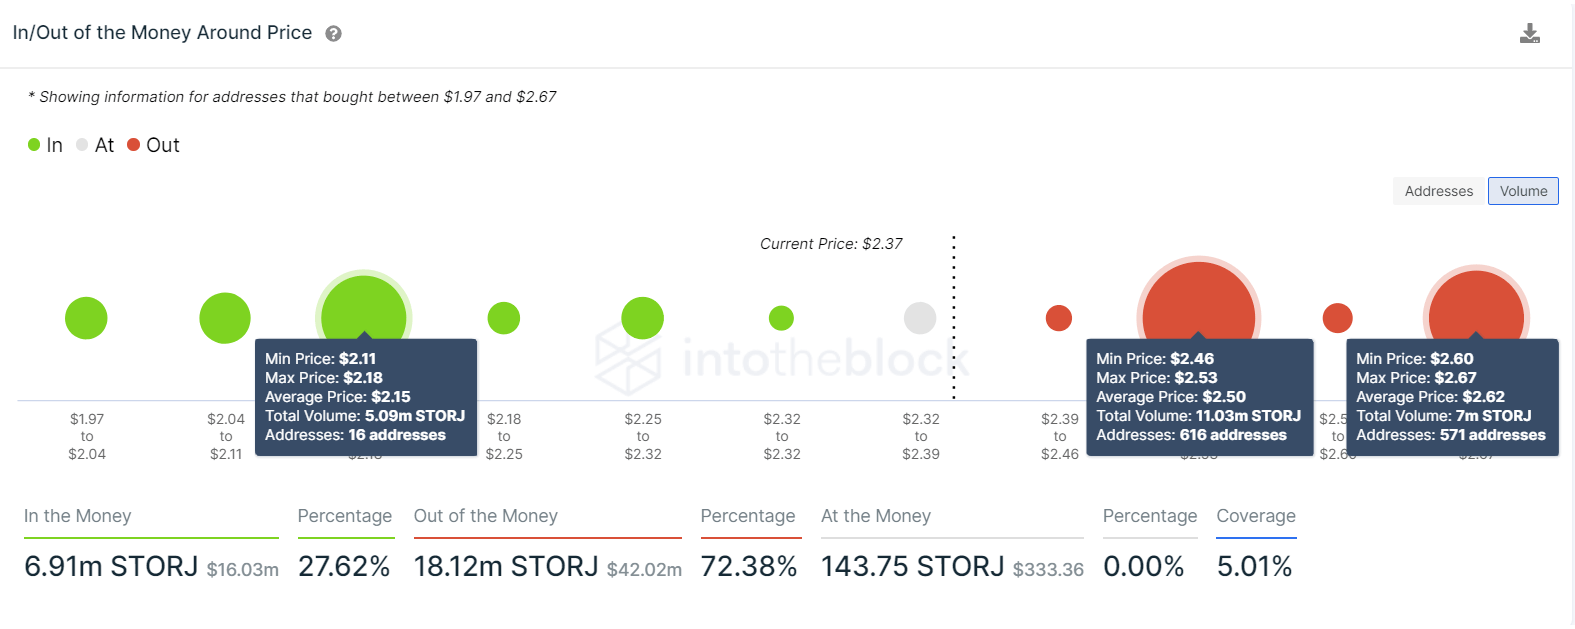
Storj IOMAP chart
On the flip side, if STROJ never gathers the momentum to surpass the said barriers, investors could look for an extended period of consolidation around $2.28.
Investors should pay close attention to the inclined trend line that connects two of the most recent swing lows. A daily candlestick close below this support level at $2.05 will invalidate the bullish outlook and kickstart a bearish one.
Under such circumstances, a 4% downtrend to the 38.2% Fibonacci retracement level, coinciding with the 50 Simple Moving Average at $1.96 seems plausible.
