- SXP is currently trading at $1.46 after establishing a robust downtrend.
- The peak of SXP was $5, reaching a market capitalization of $314 million.
After a tremendous month in July and half of August, it seems that most of the hype behind SXP is now gone. The digital asset peaked at $5 on Binance but has lost more than 70% of its value in the last month and a half.
SXP/USD daily chart
-637359563819201804.png)
It seems that the only support level closeby is $1.25, established on July 27. Bears have been able to continuously push the price of SXP down, creating lower lows and higher lows.
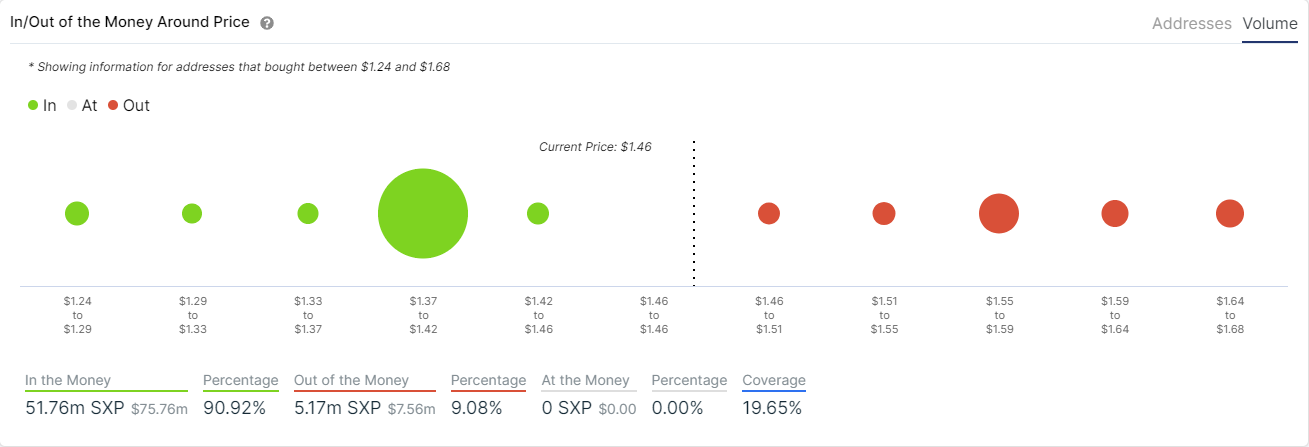
Studying the IOMAP chart, we can clearly see a massive support level right at $1.39 and nothing else around. A bearish breakout of this level would most likely take SXP down to $1.25.
SXP/USD 4-hour chart
-637359564180331979.png)
Bears still need to remain careful as the 4-hour chart could flip bullish in the short-term thanks to a buy signal from the TD sequential indicator. The RSI is also quite overextended and close to dropping below 30.
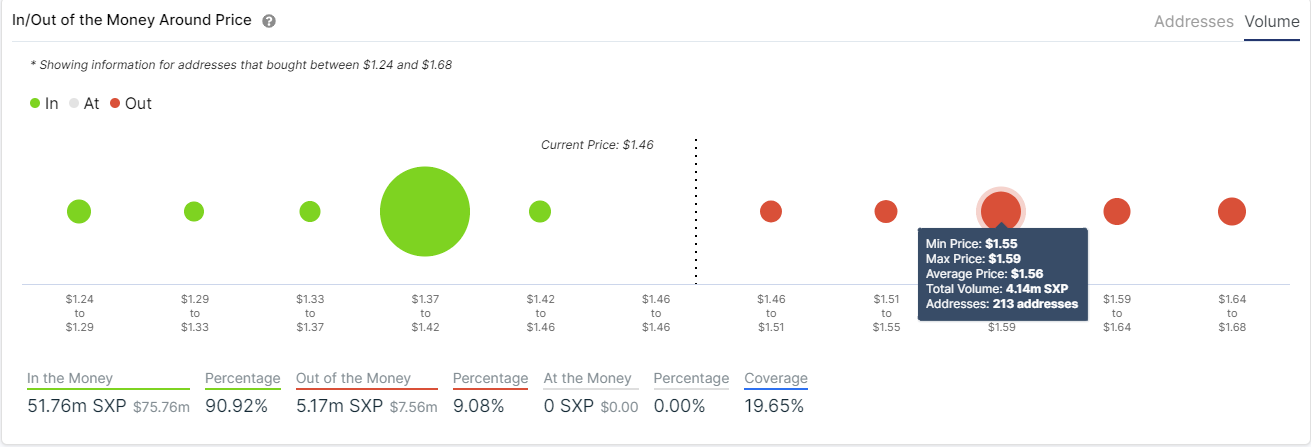
Additionally, looking at the IOMAP chart again, a defense of the $1.39 support level could help SXP to bounce back up and aim for $1.65 as there are relatively low resistance levels on the way up.
