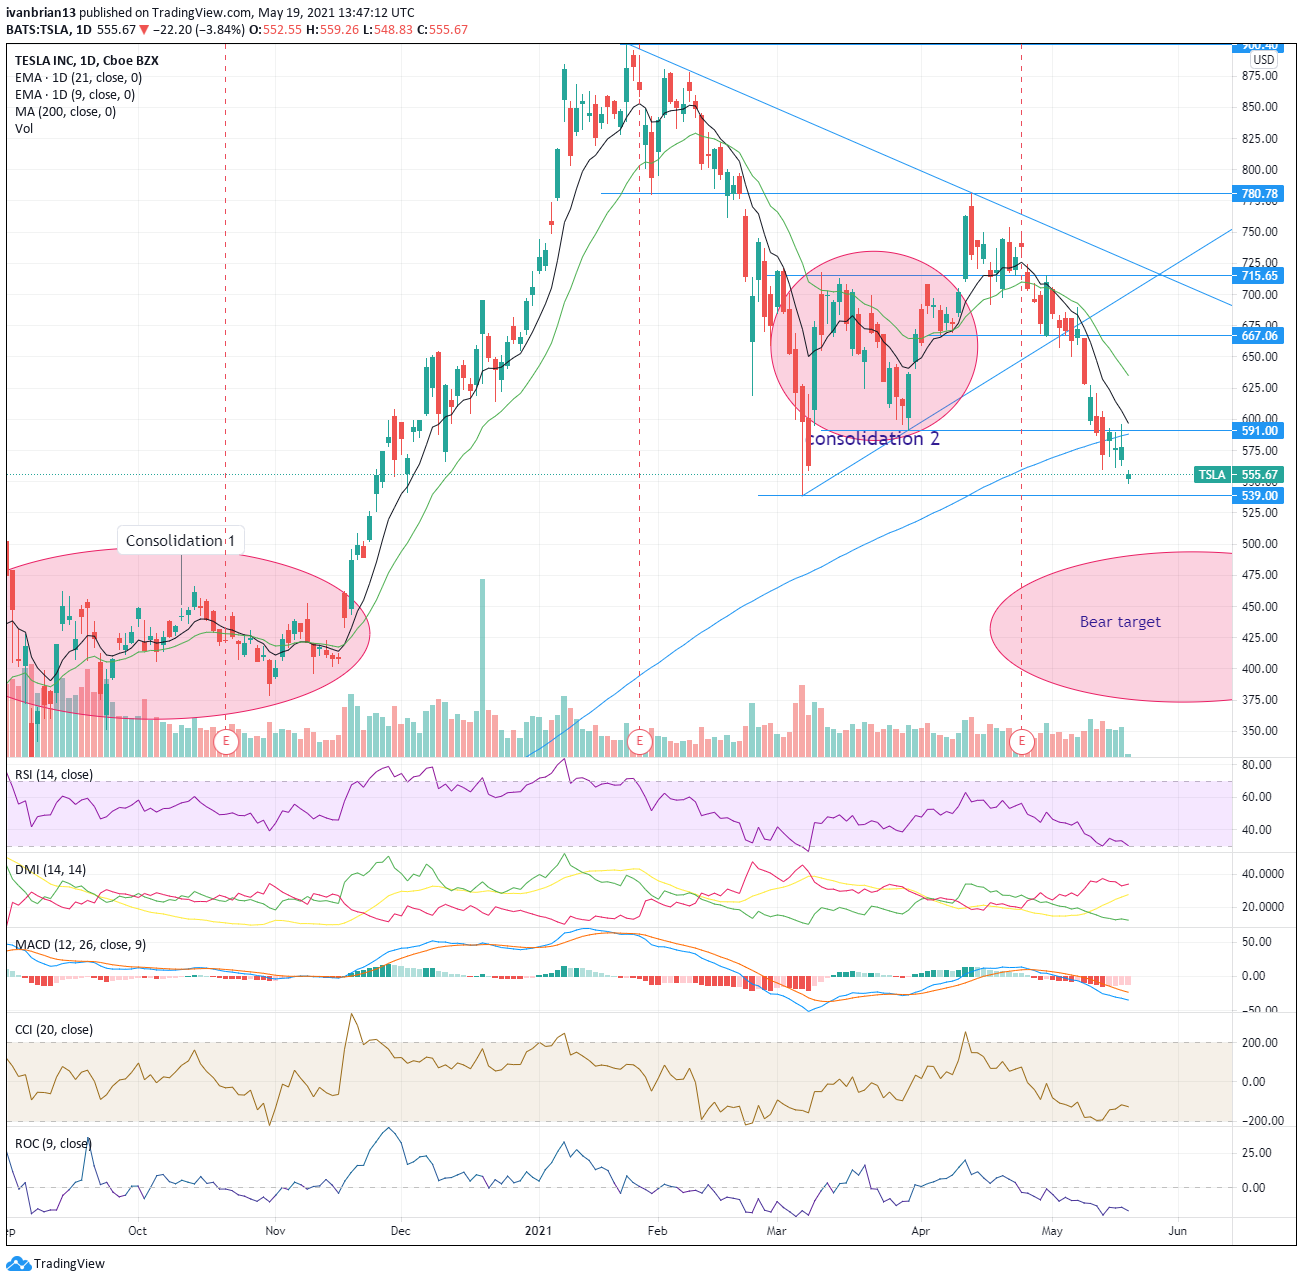
- Tesla still heading for sub $500, support at $539 on the way.
- TSLA shares are likely to suffer for their bitcoin investment.
- TSLA breaks the 200-day moving average key level.
Tesla shares continue to suffer, facing many headwinds in 2021. Recently the mix of revenue worried investors with environmental credits and revenue from Bitcoin overshadowing revenue from electric vehicle sales. Disappointing data from China on EV car sales have also hurt the share price.
Now the perfect storm continues as Tesla’s investment in Bitcoin takes a bath as the cryptocurrency dumps alarmingly toward $30,00 and loses 20% before the market opens on Wednesday.
See FAANGT technical analysis
Tesla has been in a classic downtrend since late January with a series of lower highs and lows. The break of $780 in late February was what really ended any hope of bulls returning as that key support was broken.
Tesla then formed a triangle set up and breaking out to the downside is another classic bearish chart set up. The target of a triangle breakout is the size of the entry but this is not a particularly clean triangle, so there is uncertainty in the breakout range.
Other bearish factors though remain in play. Tesla broke the trendline support and targeted the 200-day moving average. This is a big and well-watched level for any financial market and it had helped to at least slow the fall in Tesla’s share price. The Bitcoin debacle on Wednesday though will likely see further pressure on TSLA shares and the 200-day support is now well and truly busted. $539 is firmly in the crosshairs for bears and likely to be hit. This was where buyers aggressively came in on March 5 and pushed TSLA markedly higher. Volume also spiked at this price level so it is strong support. If it breaks, Tesla shares will likely accelerate the move to sub-$500 levels. The reason for the acceleration is clearly evident in the lack of price discovery and time in the move from $440 to $540 on the way up. Tesla found little resistance through this area on the way up, so the same is likely on the way down. Tesla will head straight for the neat psychological $500 level before a test of the bear target we have identified in our chart at the $440 region. This should at least contain further damage as it is a strong consolidation area for TSLA shares.
The Moving Average Convergence Divergence (MACD) and Directional Movement Index (DMI) are both crossed into a bearish sign. The Relative Strength Index (RSI) and Commodity Channel Index (CCI) are both indicators showing overbought or oversold conditions. Both of these indicators flagged that Tesla was oversold on May 13. The RSI and CCI did not give strong signals as they barely crossed into oversold territory but this, combined with the 200-day moving average support saw a brief stall but now Bitcoin has helped break any lingering support.
For Tesla to truly turn bullish the job is getting harder and harder. The first task is to stabilize and perhaps $539 is the place to try this. But it is a long way to actually turn bullish. The 9-day moving average at $597 is now distant but only above $667 can bulls say they are in control of the narrative.
| Support | 539 | 500 | 465 | 440 | 430 | |
| Resistance | 588 200-day | 591 | 667 bullish | 715 | 781 | 900 |