- Tezos price has gained 17% this week.
- A successful breakout over topside trend line key to bullish outlook.
- Volume expansion would add credibility to the rally.
Tezos price is breaking out from a three-week consolidation process along the 10-week simple moving average (SMA). A clear breach of the topside trend line at $5.37 will break the precedent of a failed breakout in February.
Tezos price not overbought on the long-term charts
Since the beginning of 2021, XTZ has constantly held the 10-week SMA on a closing basis, demonstrating consistent, almost methodological demand for the altcoin.
If the rally continues this week, the first resistance will be the topside trend line at $5.37, followed by the February high at $5.66. Still, traders should set their sights on the 1.382 Fibonacci extension of the February correction at $6.71, delivering a gain of 35% from the current price. An aggressive target is the 1.618 extension level at $7.35.
To be detailed, traders should go beyond the apparent levels and consider that XTZ reached a 100% deviation from the 40-week SMA at the August 2020 high. At the February high, it reached a 110% deviation from the moving average. Splitting them down the middle would equal a price target of $6.10.
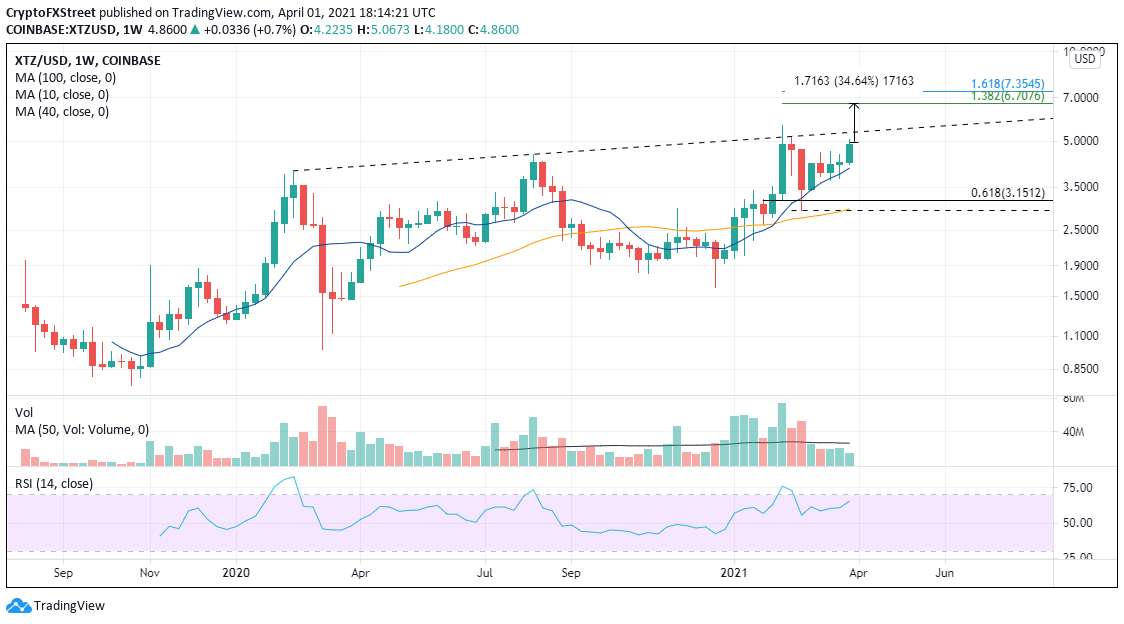
XTZ/USD weekly chart
A rejection at the topside trend line on a weekly closing basis would raise the odds that XTZ will revert to the 10-week SMA at $4.06. Subsequent support may appear at the 0.618 Fibonacci retracement of the rally from the December low at $3.15. A more critical foothold is the February low convergence with the 40-week SMA at $2.92-$2.95.
