- XTZ/USD bears stayed in control of the market for the third straight day.
- William’s %R has dipped into the oversold zone, showing that Tezos is currently undervalued.
- The Elliott Oscillator shows two straight red sessions.
XTZ/USD daily chart
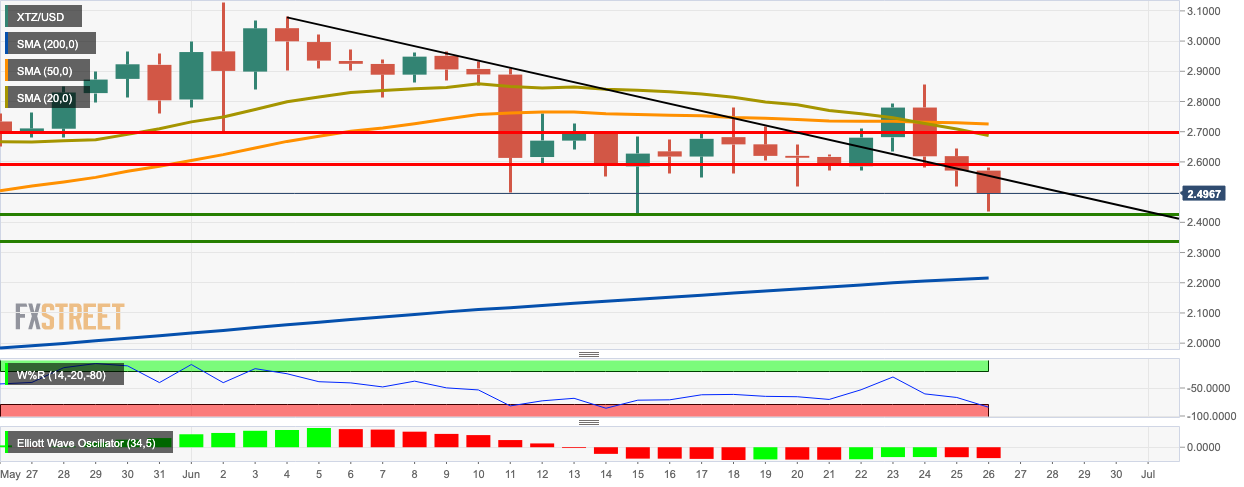
XTZ/USD bears remained in control for the third straight day. XTZ/USD fell from $2.573 to $2.497 this Friday. William’s %R has dipped into the oversold zone, showing that Tezos is currently undervalued, while the Elliott Oscillator has had two straight red sessions. SMA 50 has already crossed over the SMA 20 curve to chart a bearish cross pattern.
Support and Resistance
XTZ/USD has strong resistance levels at $2.593, $2.70 (SMA 20) and $2.73 (SMA 50). On the downside, healthy support levels lie at $2.424, $2.34 and $2.22 (SMA 200).
