- Tezos price remains contained inside a descending parallel channel on the 12-hour chart.
- Bulls have just defended the lower trendline support and aim for a rebound.
Tezos has been under consolidation since its high of $2.96 on November 25. The digital asset currently trades at $1.97. Bulls try to defend a critical support level at $1.9 which should push Tezos price towards $2.3.
Tezos price is bearish but there is hope
On the 12-hour chart, Tezos has established a descending parallel channel and bulls have just defended the lower trendline support. If the digital asset can successfully close above $1.9, it could jump towards the middle of the pattern at $2.1 before a small retrace followed by a final move towards the upper boundary at $2.3.
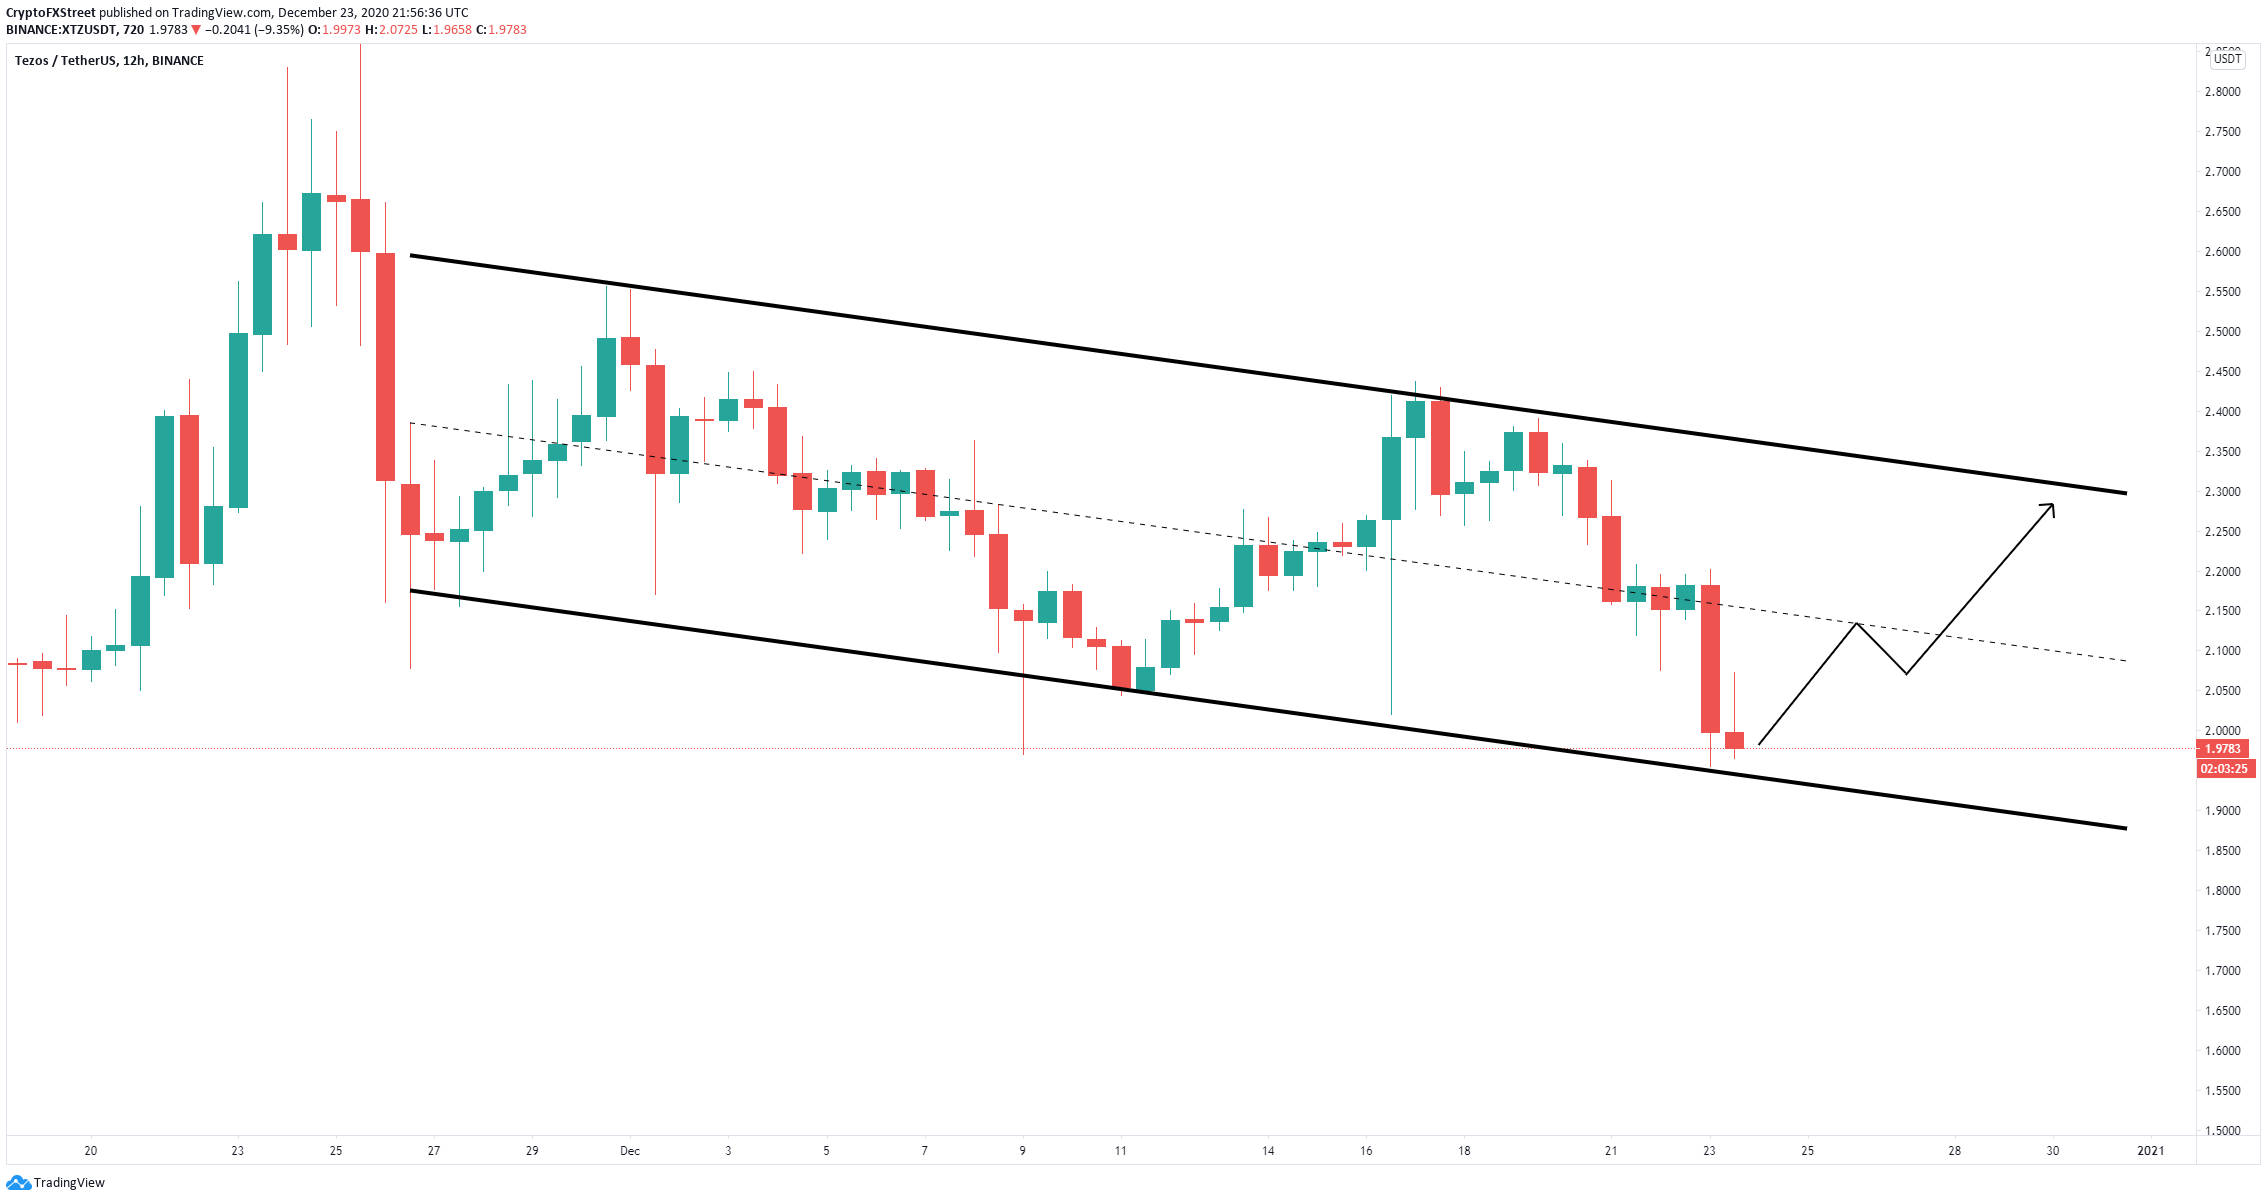
XTZ/USD 12-hour chart
Although XTZ could be gearing up for a rebound, bears remain in control of the 12-hour chart which is in a downtrend. They have managed to push Tezos price below the 100-SMA and the 50-SMA, turning both into resistance points.
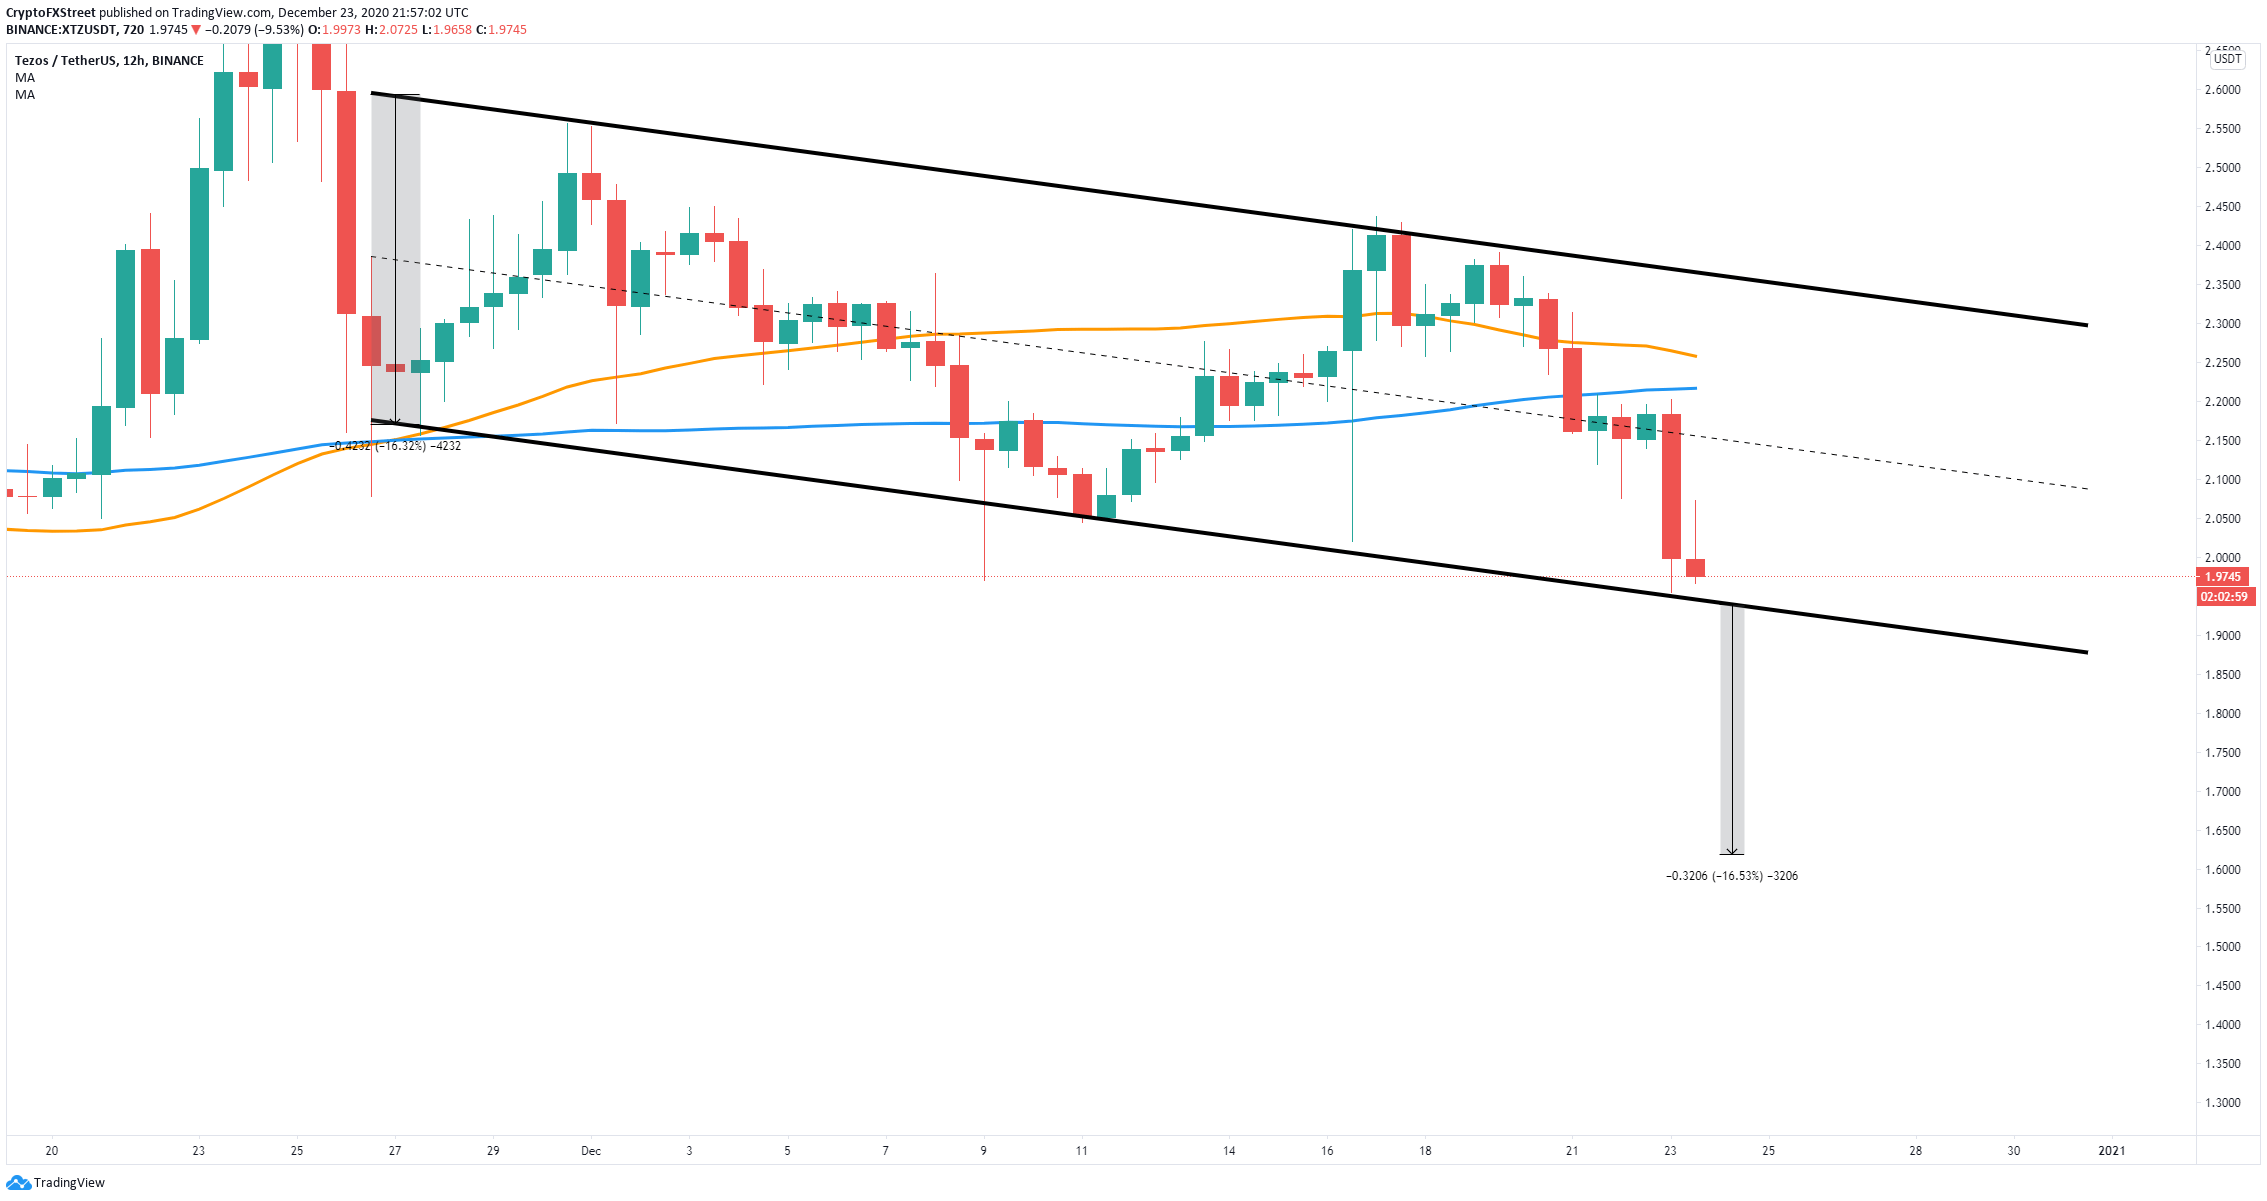
XTZ/USD 12-hour chart
The next critical support level is $1.9 which is the lower trendline of the descending parallel channel. A breakdown below this point will drive XTZ towards a low of $1.6, a 16% move, calculated using the height of the pattern as a reference point.
