- Tezos price is currently breaking out and seeking higher highs after touching $2.97.
- Some technical indicators are showing that XTZ could potentially pullback in the short-term.
Tezos is up by 45% in the past week as it was one of the few cryptocurrencies left to go up. Bulls face a critical resistance level at $3, and some technical indicators suggest that investors should sell in the short-term.
Tezos price needs to crack $3 but might need to pull back first
On the 9-hour chart, the TD Sequential indicator has presented a sell signal at $2.9 after a rejection from the psychological level at $3. The RSI remains slightly overextended, which is also adding even more selling pressure to XTZ.
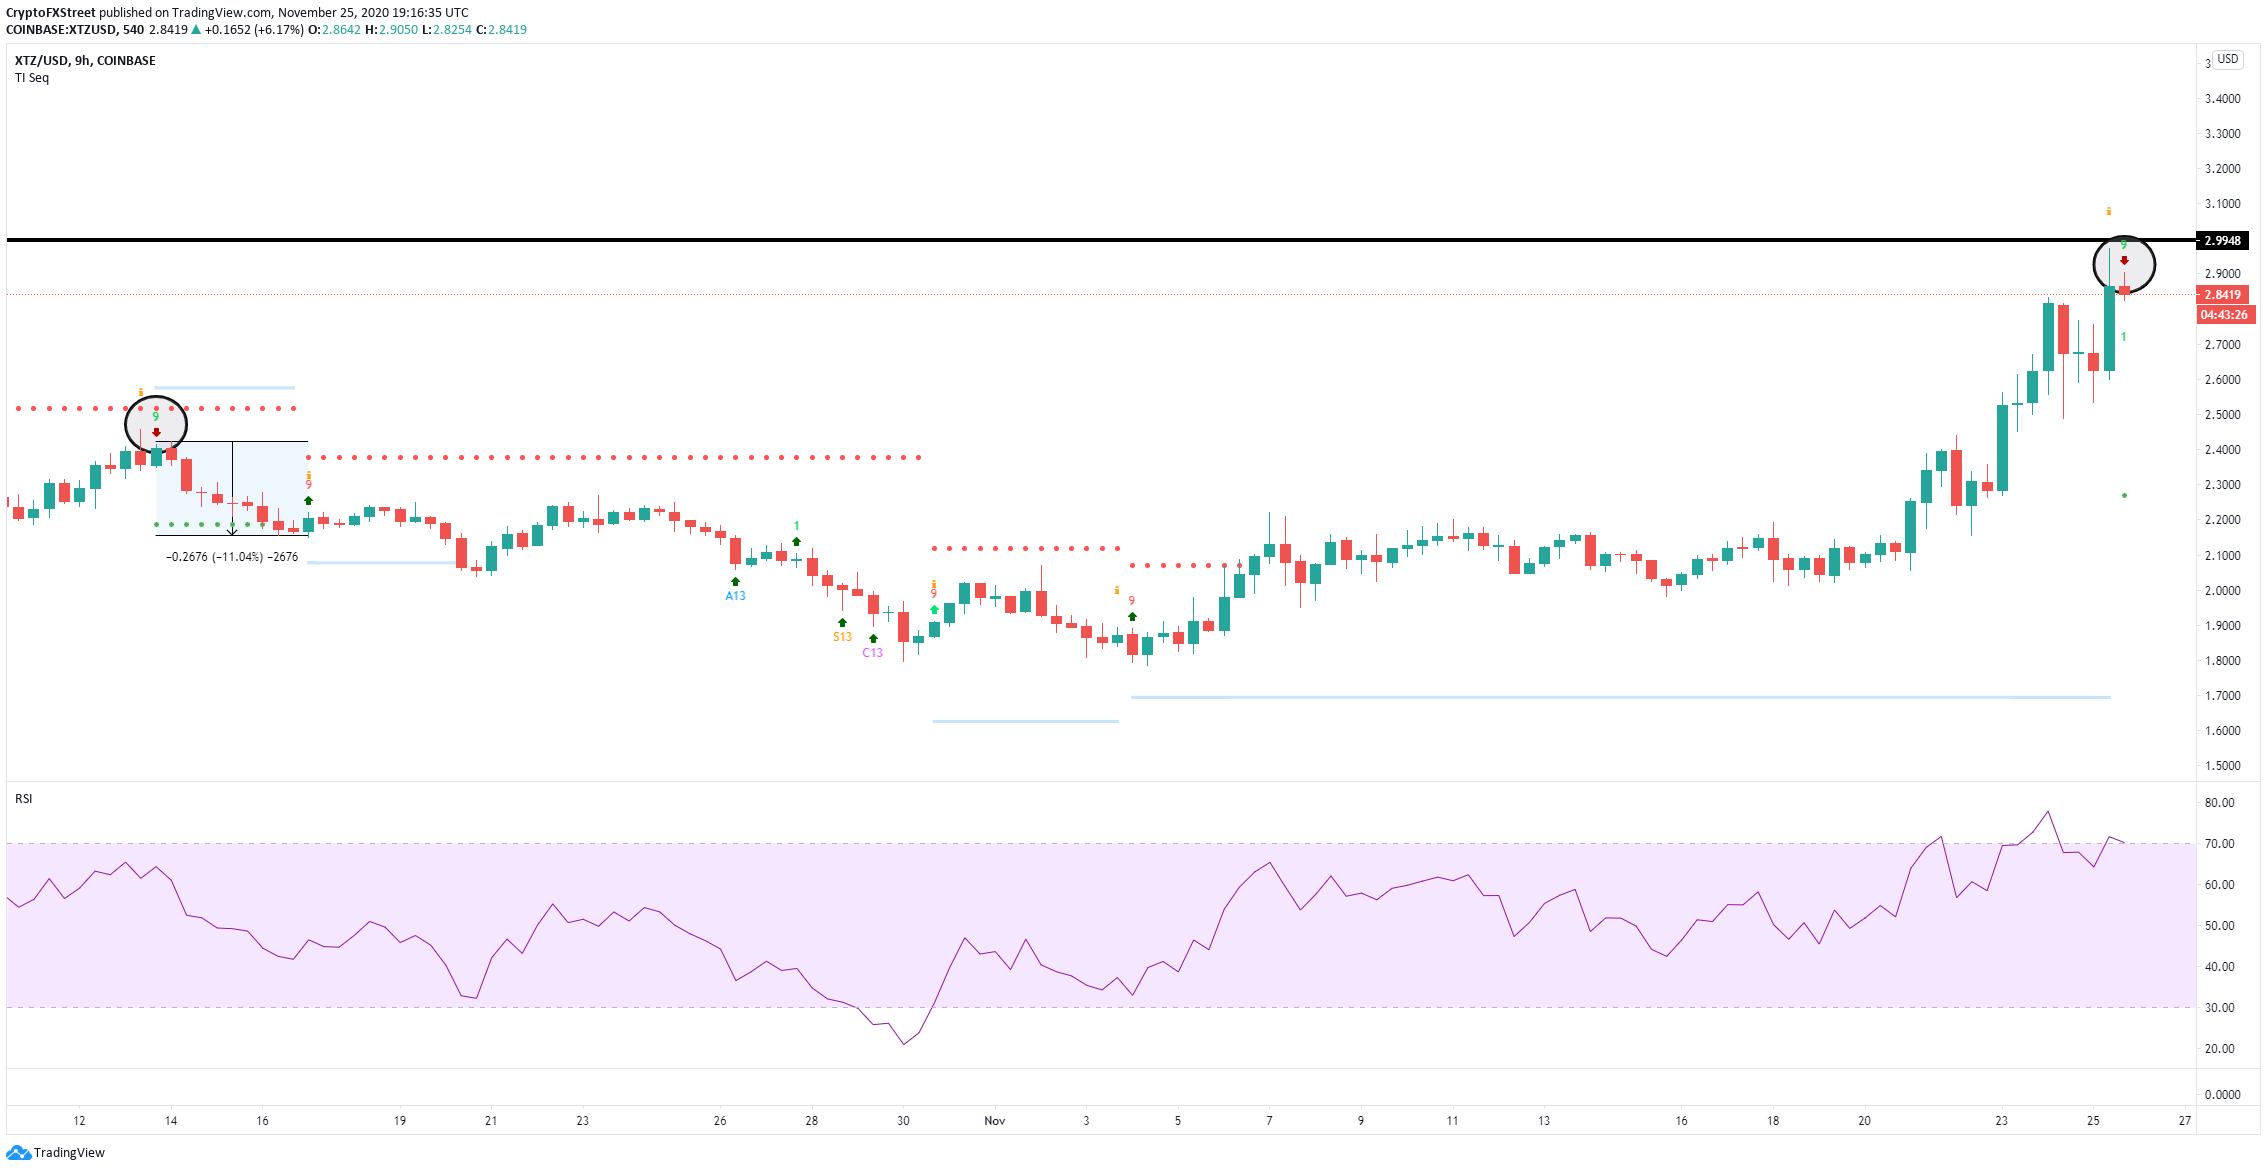
XTZ/USD 9-hour chart
The last sell signal on October 13 was accurate and got validated with an 11% follow-through. The nearest bearish price target would be the low at $2.5, followed by the psychological support level of $2.
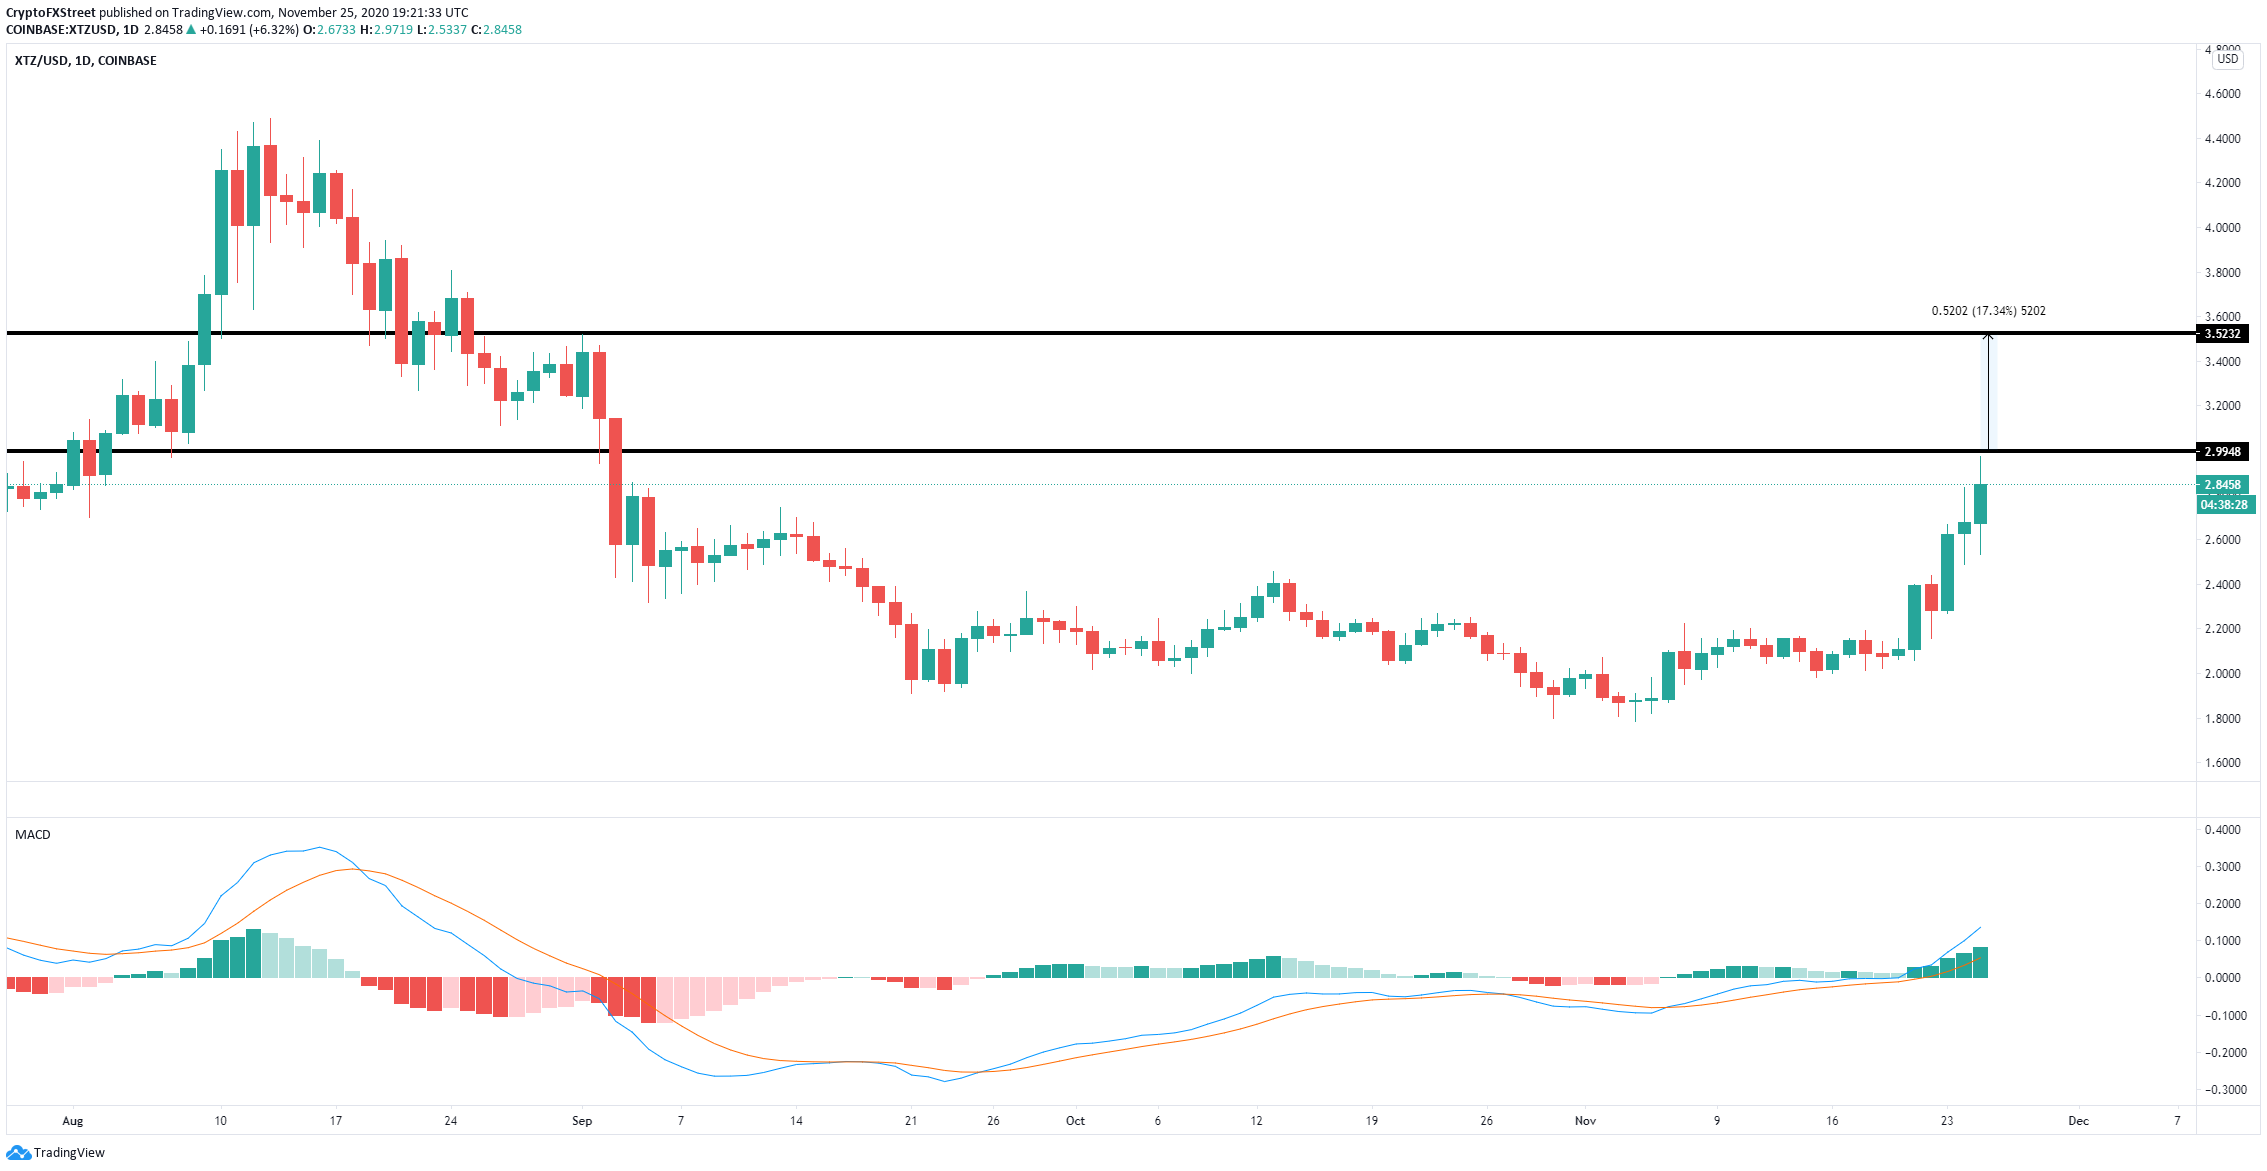
XTZ/USD daily chart
On the other hand, a breakout above the resistance level at $3 could quickly drive Tezos price towards the next price target at $3.52 on the daily chart. The MACD flipped bullish on November 6, and it’s gaining strength.
