- Tezos price is trading right below a critical resistance level at $3.43.
- The digital asset faces a lot of selling pressure in the short-term according to a significant indicator.
- XTZ might be poised for a pullback before another leg up resuming the uptrend.
Tezos has been trading in a robust uptrend since December 24, 2020, but has topped out at a crucial resistance level several times. It seems that the digital asset is bound to see another correction as a critical indicator has flashed a sell signal.
Tezos price faces a lot of pressure in the short-term
On the 12-hour chart, the TD Sequential indicator has just presented a sell signal right below a crucial resistance level at $3.43 formed since August 2020. Tezos has been unable to close above this critical point for over six months.
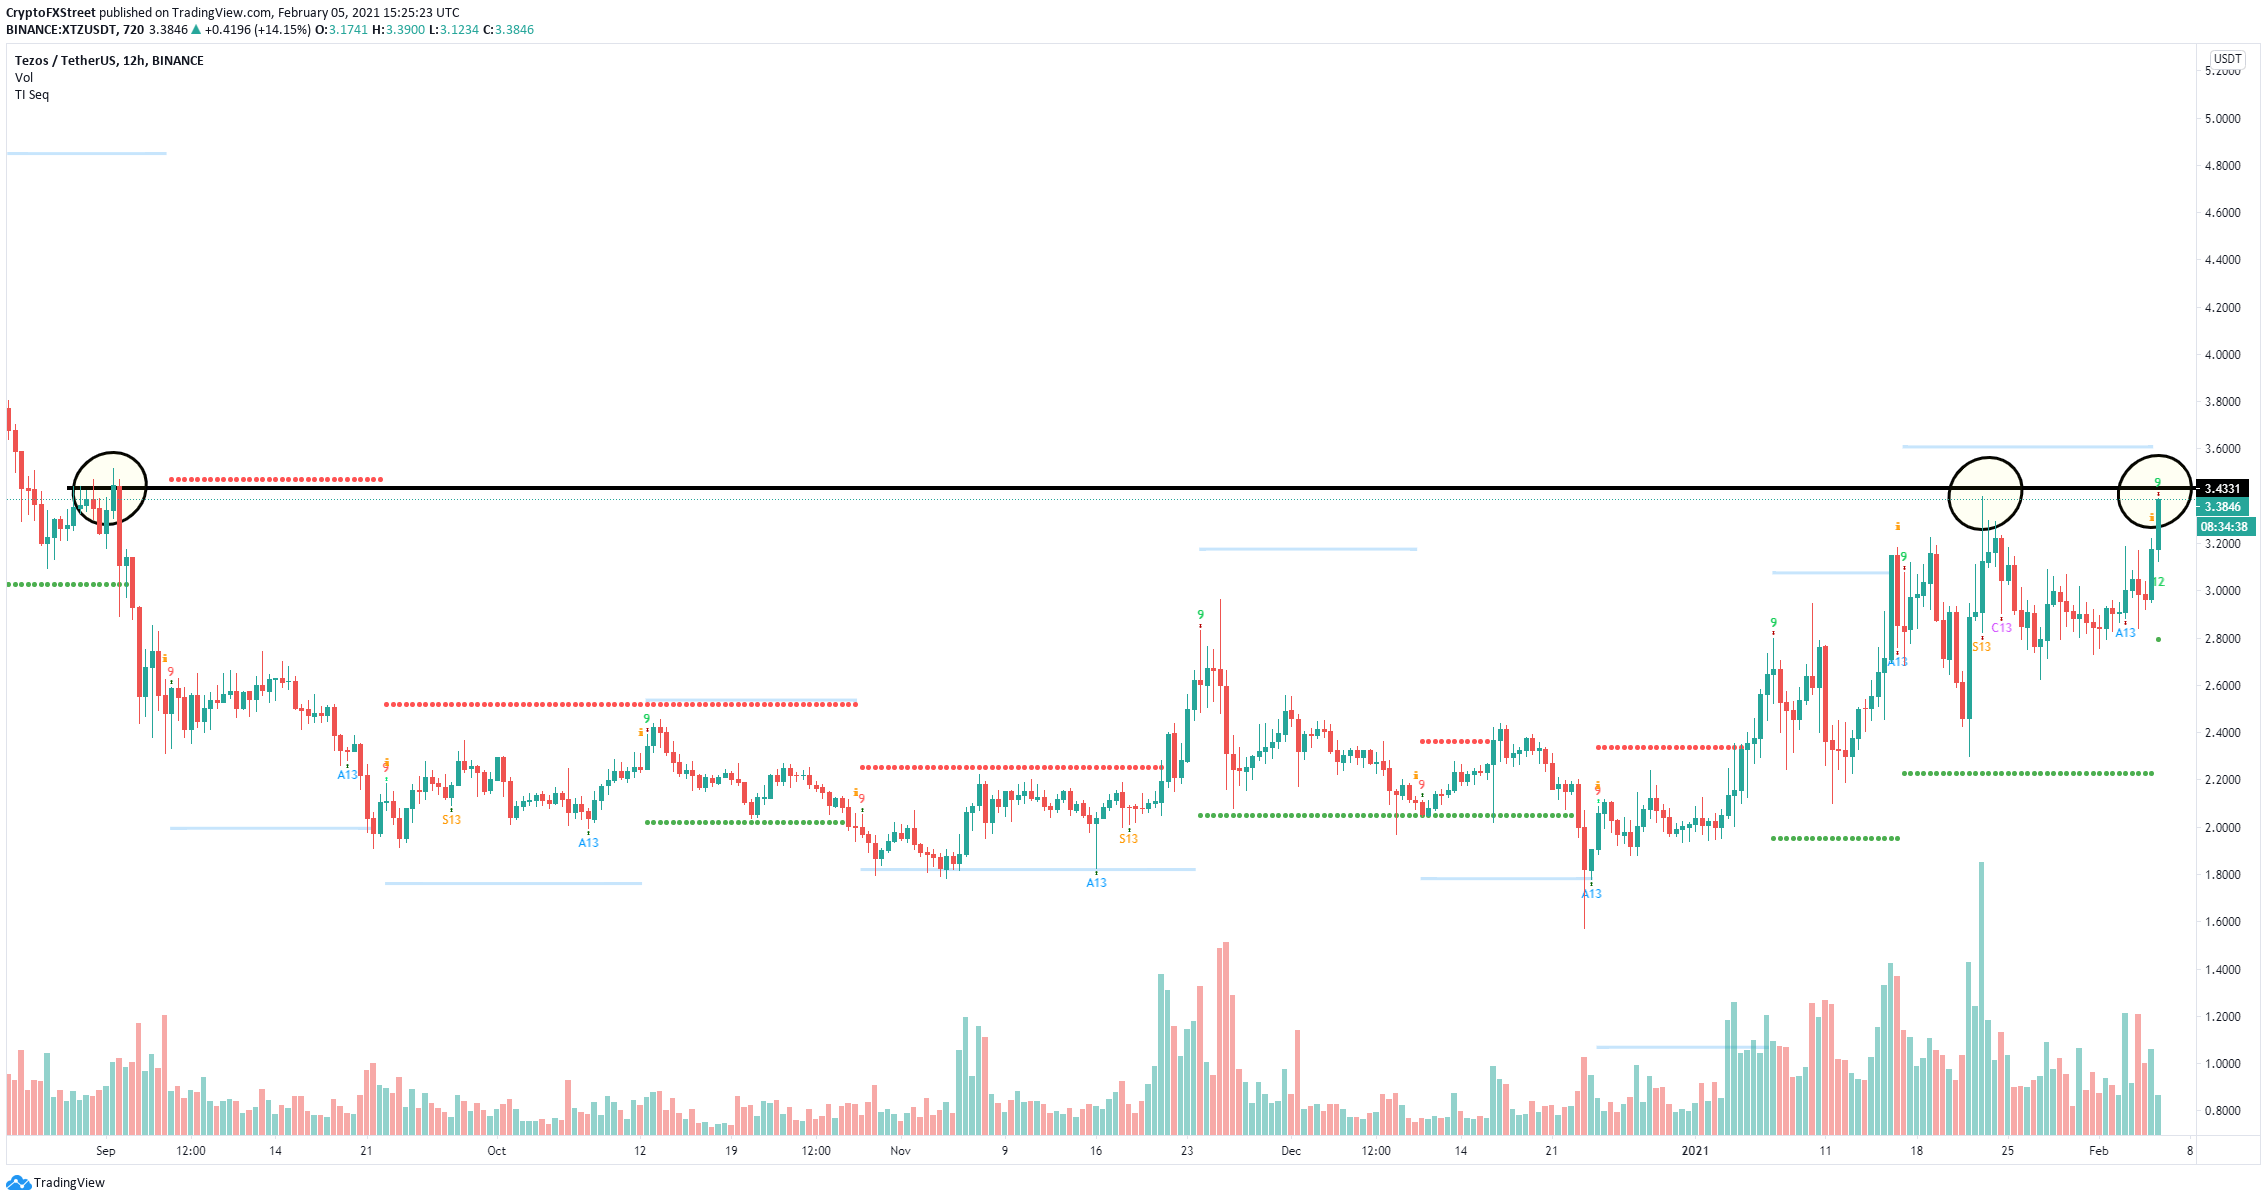
XTZ/USD 12-hour chart
As the TD presented a sell signal, Tezos price is bound for another rejection from the critical resistance level and can quickly fall towards the psychological support level at $3 in the short-term.
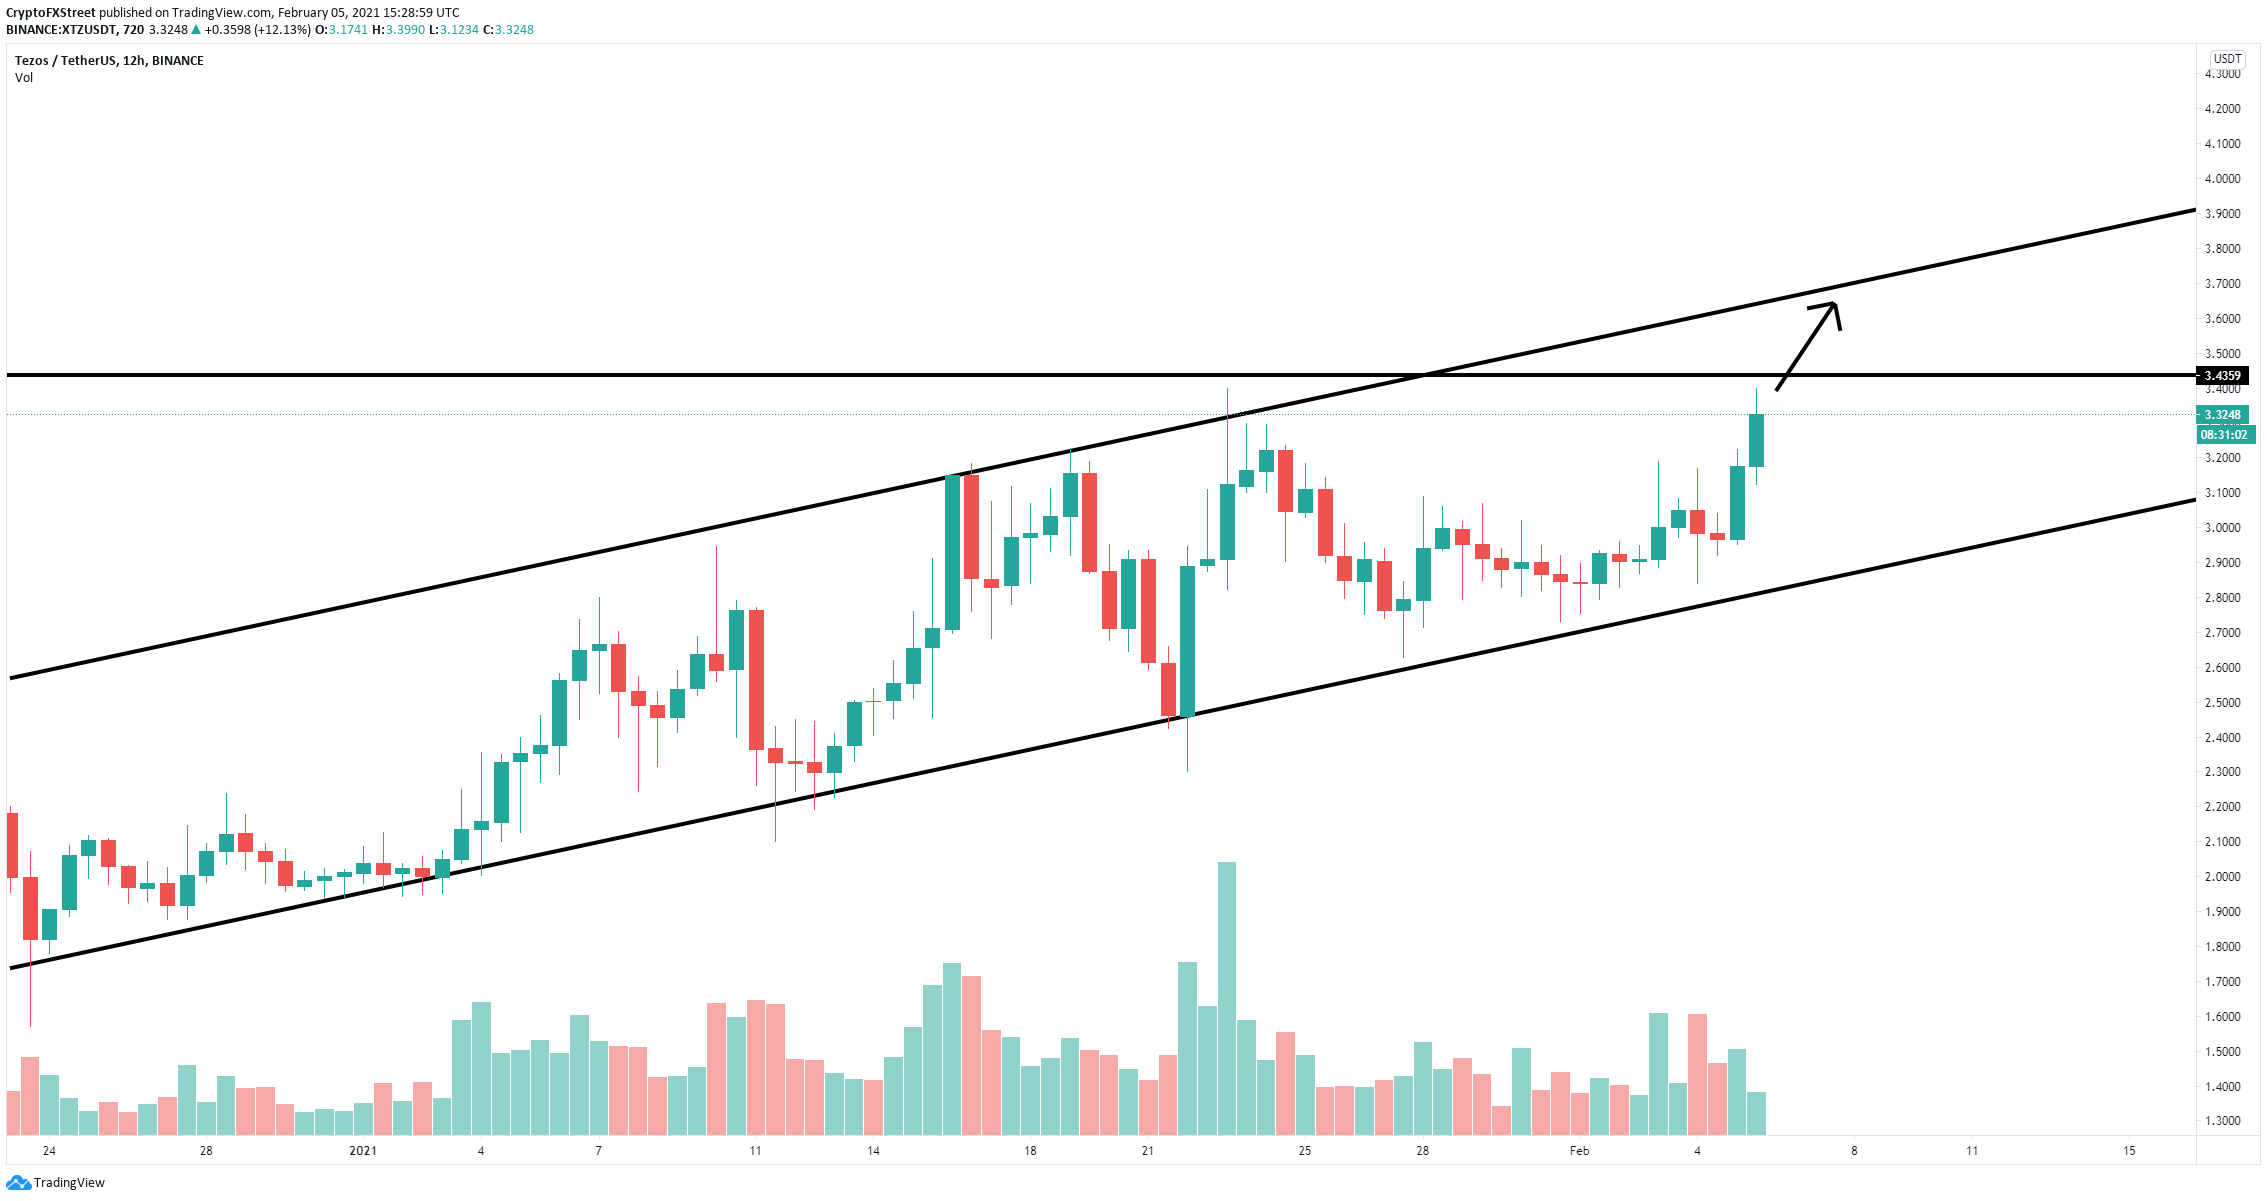
XTZ/USD 12-hour chart
However, it’s important to note that Tezos is currently inside a robust uptrend across most time frames and can invalidated the sell signal by climbing above the resistance level at $3.43. Additionally, on the 12-hour chart, Tezos has also formed an ascending parallel channel. A breakout above $3.43 will drive Tezos price towards the upper trendline of the pattern at $3.7.
