- Tezos is looking forward to a remarkable upswing to $3 if the triangle x-axis is broken.
- XTZ/USD will abandon the bullish outlook if the price closes the day under the 50 SMA on the 4-hour chart.
Tezos is trading at $2.4 following an impressive recovery from the recently established support at $2.16. The breakdown necessitated the upswing at the beginning of December from a price level of around $2.6. For now, all attention has been channelled to breaking the stubborn resistance at $2.44 to pave the way for gains toward $3.
Tezos rebounds from crucial support as a breakout looms
Over the last seven days, Tezos price action has led to the formation of an ascending triangle in the hourly timeframe chart. The x-axis has been presented as a barrier that continues to hinder price movement. On the other hand, an ascending trendline has connected the swing lows.
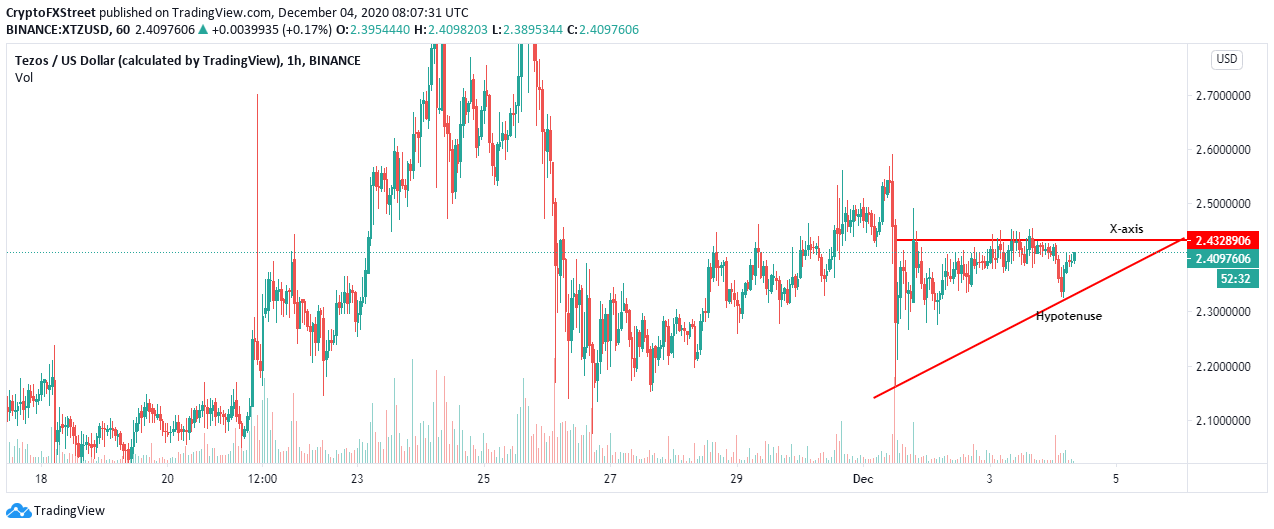
XTZ/USD 1-hour chart
An upsurge in buying pressure around the prevailing price level will likely boost XTZ above the critical hurdle at $2.44. Thrusting through this supply area will probably jumpstart Tezos uptrend by more than 20% toward the next seller congestion at $3.
The upswing above the triangle is usually arrived at by measuring the distance between the widest ranges and adding it to the break out point.

XTZ/USD 4-hour chart
The 4-hour chart shows that the optimistic outlook will be invalidated if Tezos price corrects below the 50 Simple Moving Average and the 100 SMA. If supply for Tezos increases due to the instability created by the correction, a downtrend would come into the picture, where declines to the 200 SMA will have to be endured.
