- Tezos price is currently bounded inside a symmetrical triangle on the 4-hour chart.
- The pattern is on the verge of a breakout or breakdown.
Tezos is currently trading at $0.23 right above a critical support level. The digital asset is bounded inside a symmetrical triangle pattern that awaits a clear breakout or breakdown within the next 24 hours.
Tezos price needs to hold this crucial support level to avoid a major pullback
XTZ has established a symmetrical triangle pattern on the 4-hour chart with the lower boundary located at $0.23. A breakdown below this point would quickly drive Tezos price towards a price target of $1.9.
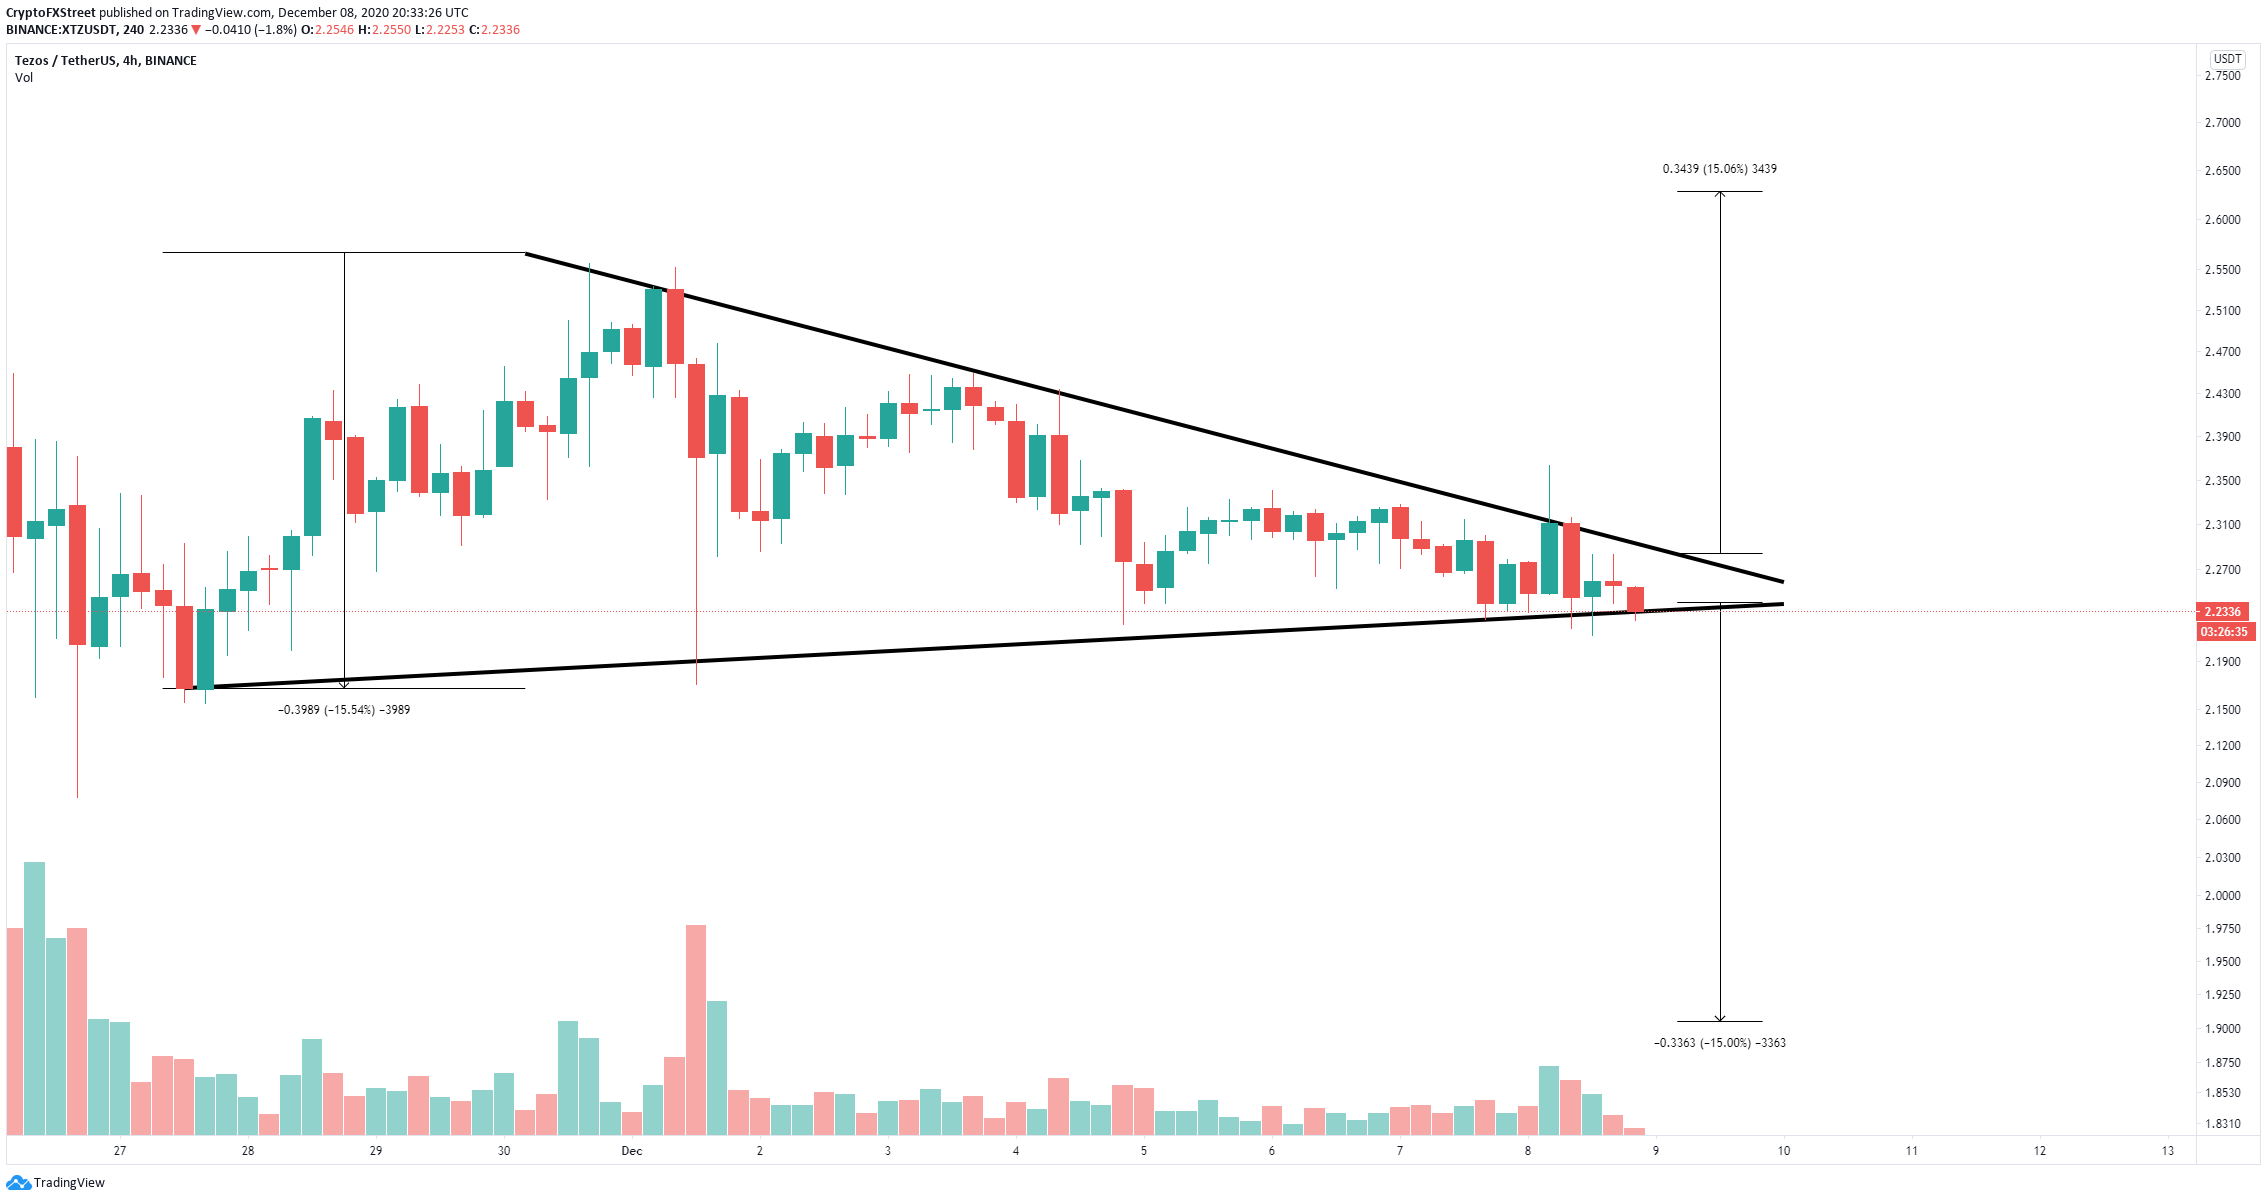
XTZ/USD 4-hour chart
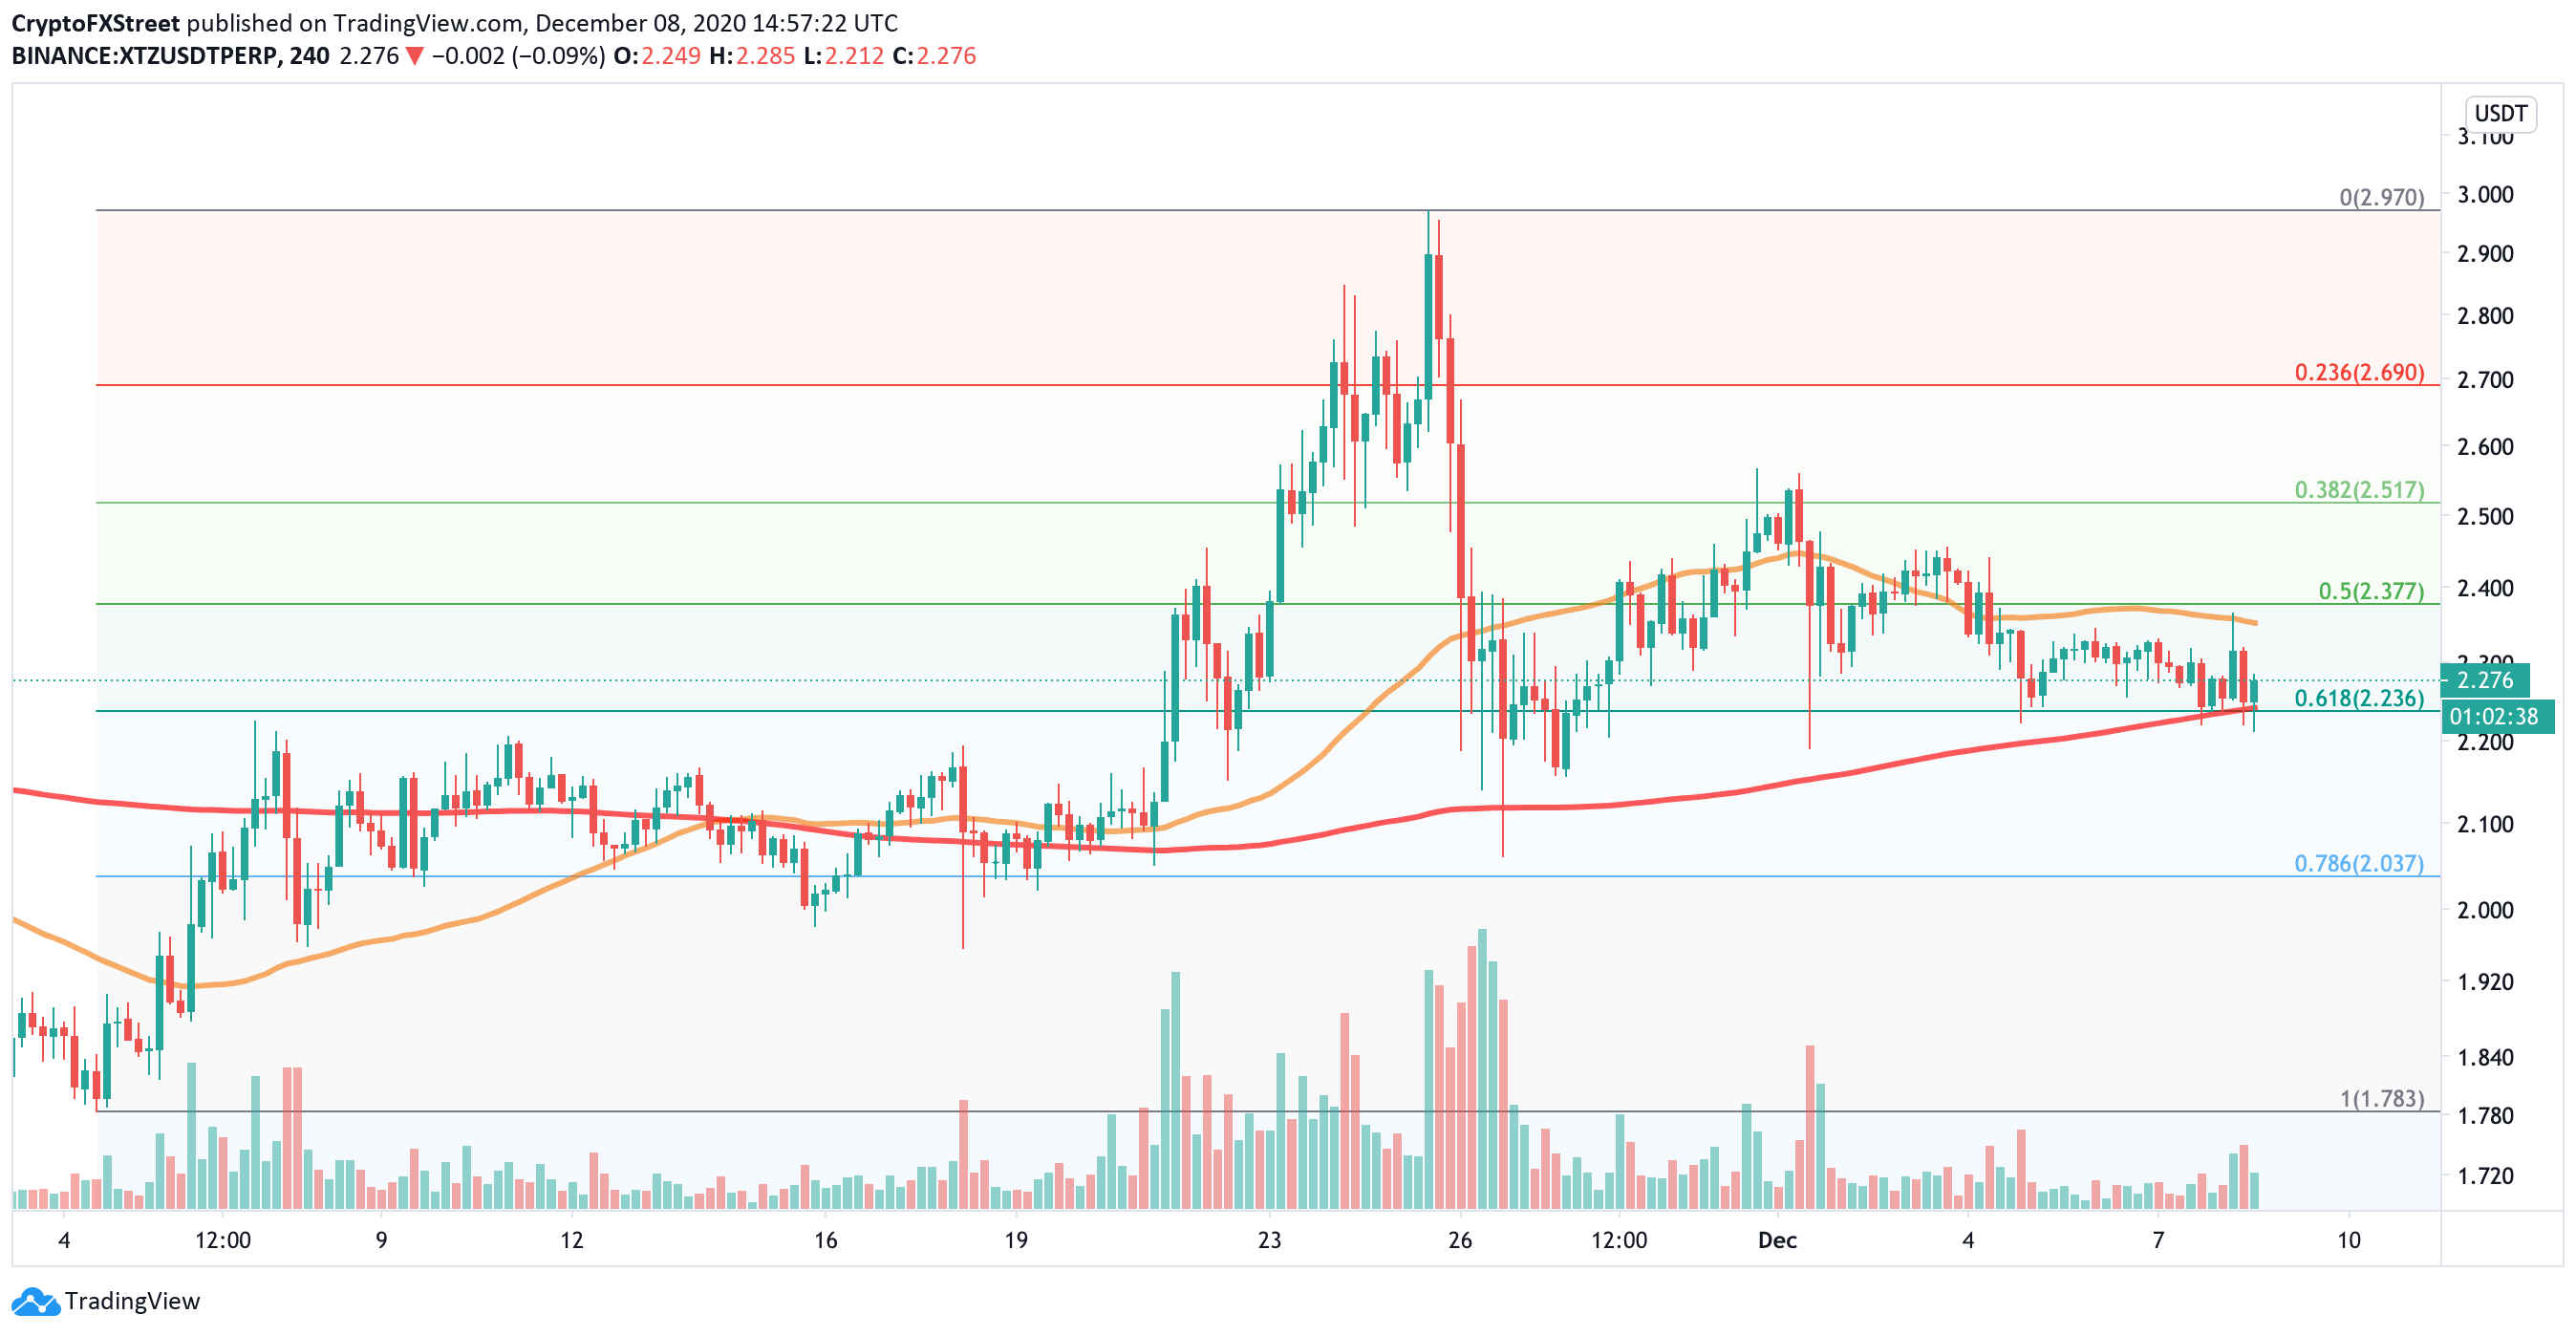
On the other hand, bulls have defended another significant support level in the form of the 200-SMA on the 4-hour chart. If Tezos price can rebound from this point, it can quickly jump towards the upper trendline of the pattern.
XTZ/USD 4-hour chart
A breakout from the triangle would drive Tezos price towards a price target of $2.63 which almost coincides with the 0.236 Fib retracement level at $2.69. The 0.5 Fib level at $2.51 is another potential price target.
