- Tezos recovered modestly after dropping to lowest level in nearly 7 months.
- Technical indicators on the daily chart show a lack of bullish momentum.
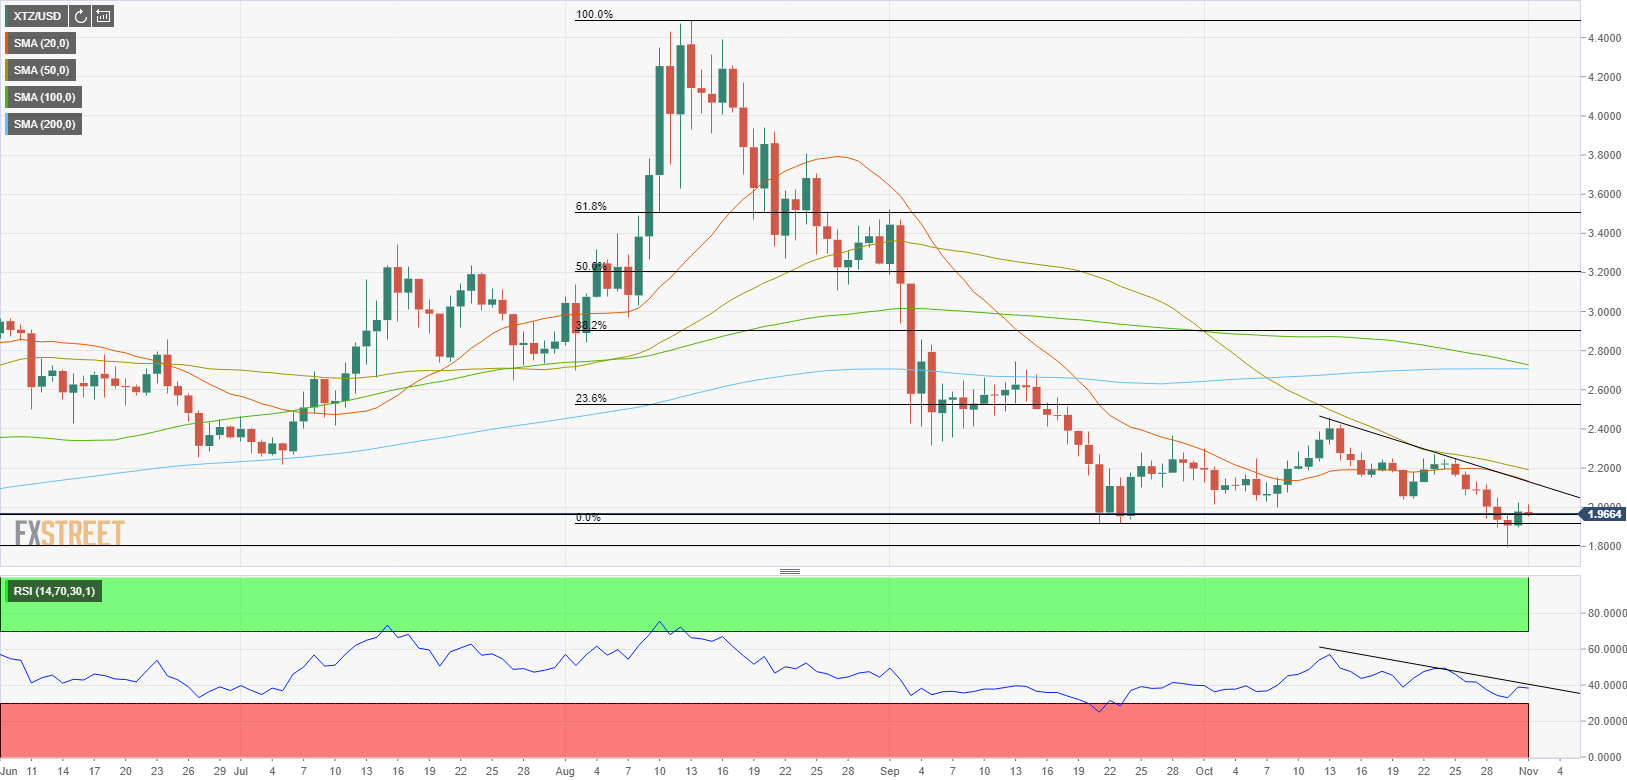
- Tezos could target $2.5 if it manages to clear $2-2.2 area.
Tezos (XTZ) closed the first five days of the week in the red and touched its lowest level since early April at $1.7969 on Friday. Although XTZ erased a small portion of its weekly losses on Saturday and gained more than 4%, it seems to be having a difficult time preserving its bullish momentum on Sunday. As of writing, XTZ was down nearly 1% on the day at $1.9650.
XTZ technical outlook
If Tezos climbs above $2 (psychological level), the price could encounter stiff resistance at $2.2 (20-day SMA/50-day SMA/descending resistance line coming from October October 13th). A daily close above that level could open the door for additional gains toward $2.5, where the Fibonacci 23.6% retracement of August-September downtrend is located.
However, the RSI indicator on the daily chart remains in the bearish territory near 40 and doesn’t show a bullish divergence yet, suggesting that buyers haven’t yet committed to a convincing rebound. On the other hand, the initial support could be seen at $1.8 (multi-month low) ahead of $1.65 (April 6 low) and $1.45 (static support area from April).
Tezos daily chart