- Bulls seeking a break of daily resistance to open prospects of a firmer test of monthly resistance.
- The 4-hour environment is ripe for a continuation higher and break of daily resistance.
Gold prices have run into a wall of resistance which guards a significant continuation target in the correction of the fresh cycle lows.
The following is a top-down analysis that illustrates where the next trading opportunities could arise from a break out scenario.
Monthly chart

The monthly chart offers room to the prior support levels as a compelling bullish prospect on repeated downside failures.
Weekly chart
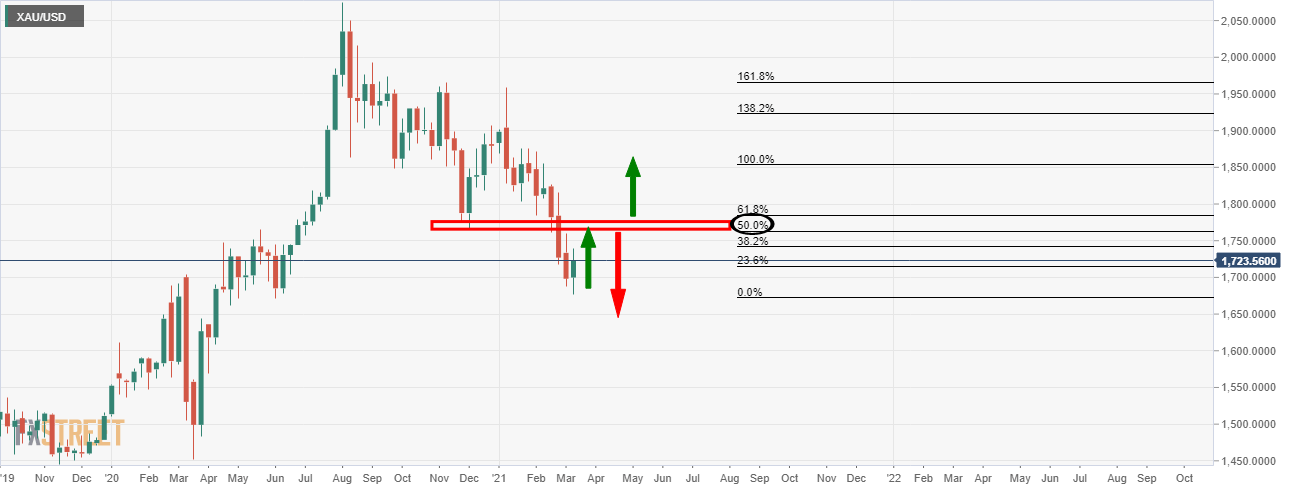
The weekly chart illustrates a 50% mean reversion confluence with the monthly upside target.
Daily chart
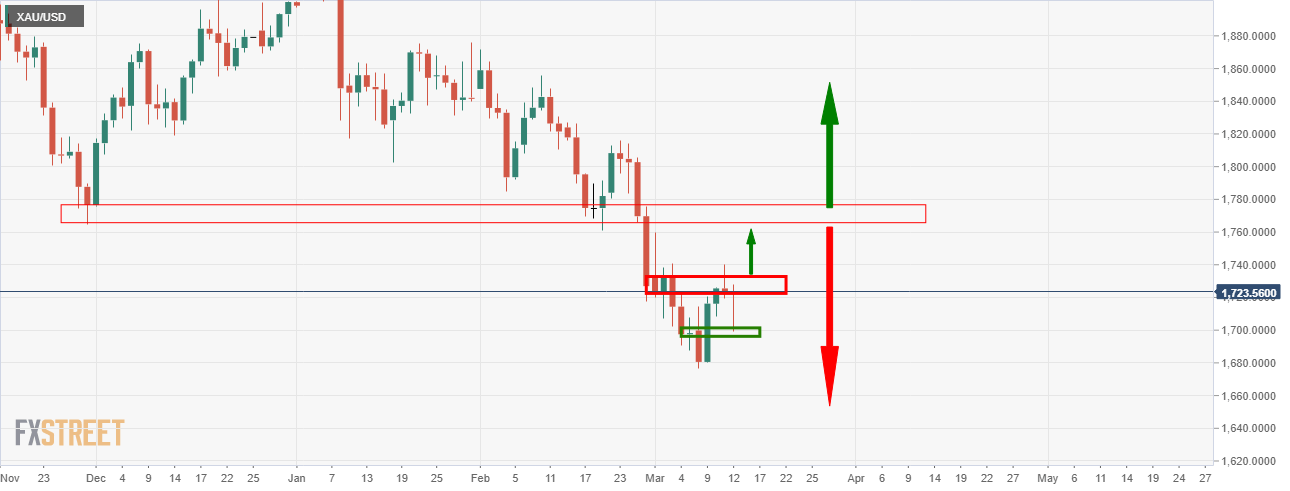
From a daily perspective, however, there is a wall of resistance that guards the upside targets.
4-hour chart

Meanwhile, the conditions are bullish for an upside continuation and break of the daily resistance.
