- The Graph Price convincingly rebounds from a test of the February low.
- Local head-and-shoulders bottom breakout confirms buying interest.
- Simple moving averages (SMA) now are support rather than resistance.
The Graph price was not able to avoid the wave of selling in the cryptocurrency complex last week. As a result, it briefly tested the February low at $1.333 before consolidating in a head-and-shoulders pattern and then rallying an additional 19%. On the fundamental side, recent Santiment data provides a mixed picture, but green shoots are forming that should be positive for the rally’s sustainability.
The Graph price rebound triggering social media activity
Like The Graph price, social volume is on an uptrend, according to Santiment. Data shows that “crypto social media bottomed out a few days ago and now seems to be increasing” as prices rebound. Moreover, the active addresses amount is currently above 1.7K, proving that “GRT tokens are being used” and on-chain activity has stabilized.
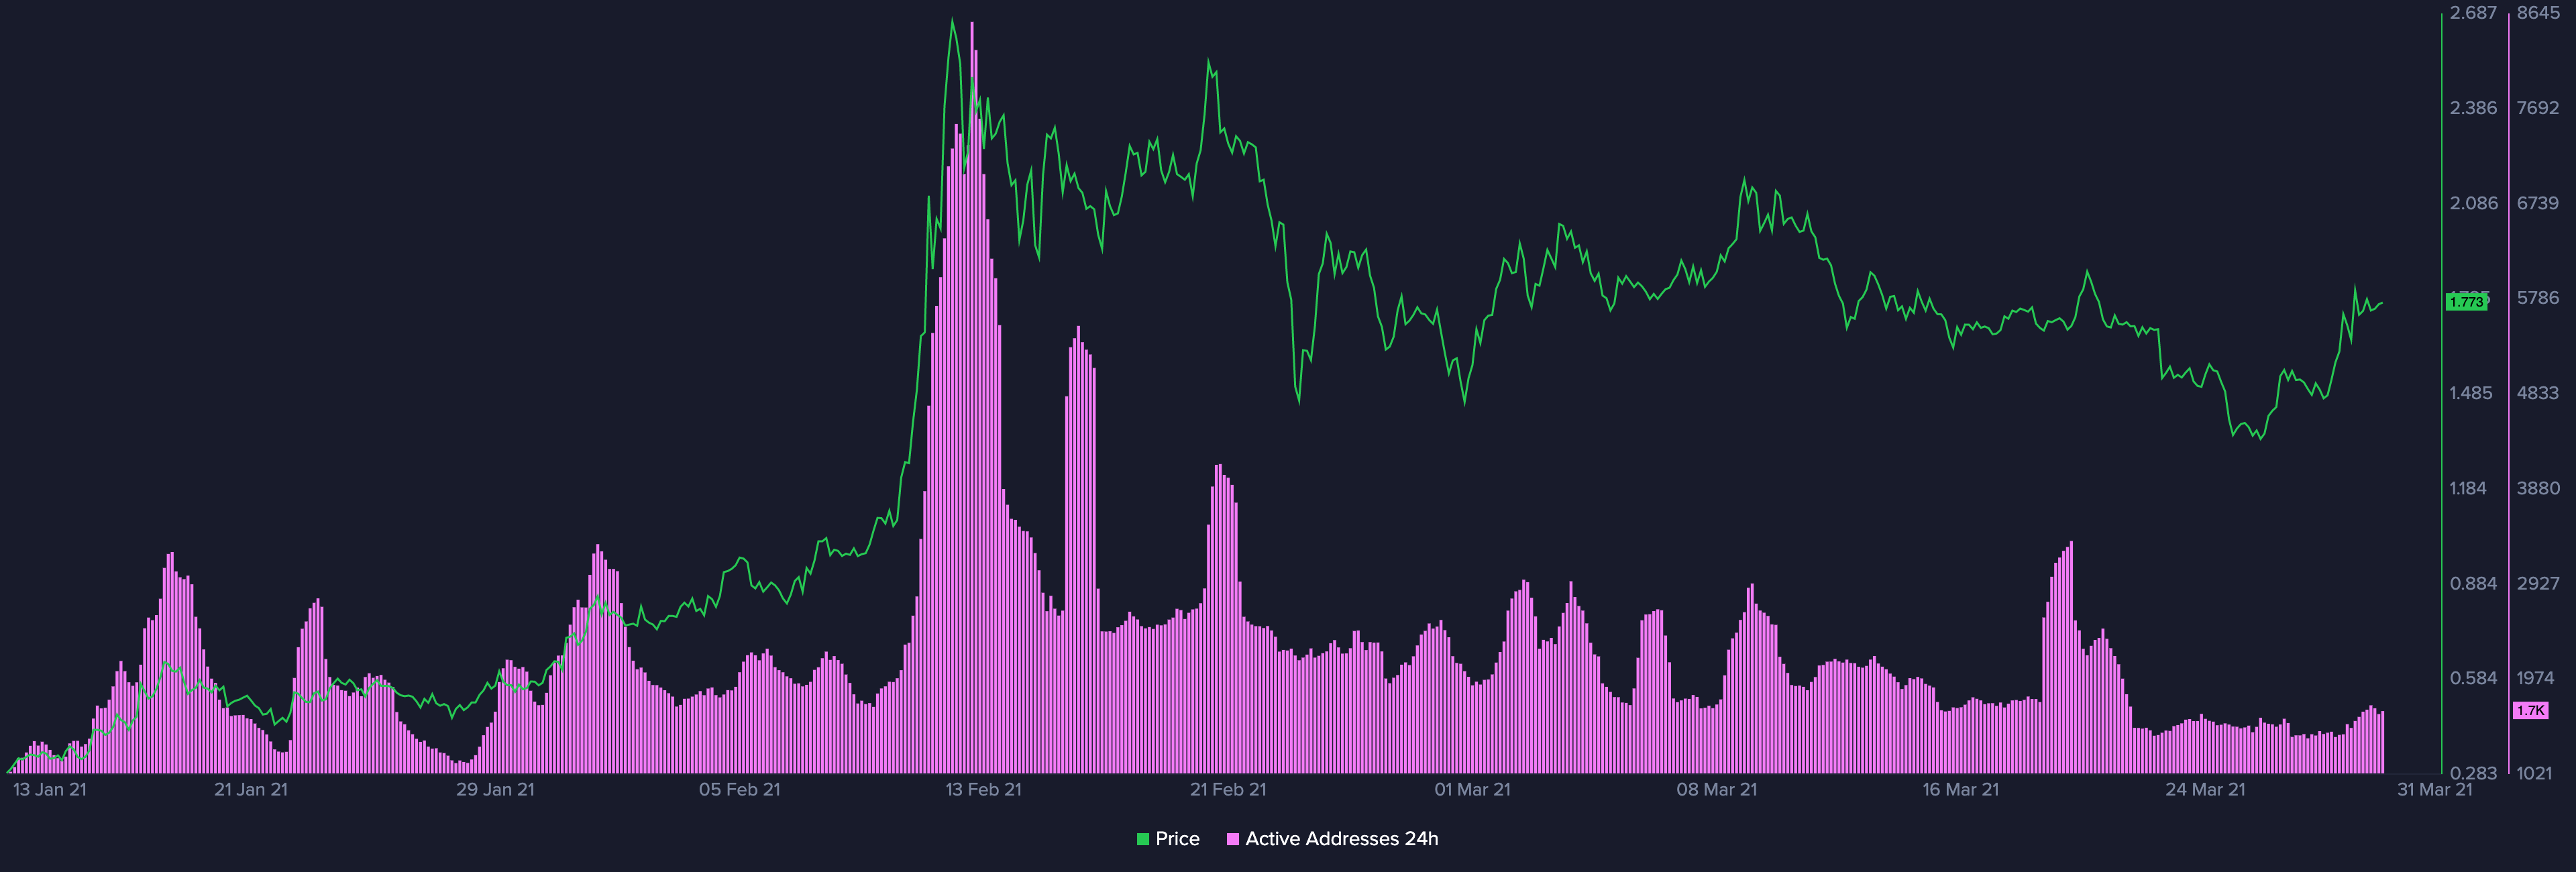
Source: Santiment (March 29, 2021)
On March 22, GRT decisively broke down below the lower trendline of a symmetrical triangle and raced to the February low. Traders had become impatient with the consolidation and quickly exited, removing the weak holders from the market.
The rebound has been compelling and on heavy volume based on the 4-hour chart, particularly after the breakout from a local head-and-shoulders bottom. GRT is now consolidating the rally just under the March 20 high at $1.878 and well above the 50 four-hour SMA and the 100 four-hour SMA. Once the short-term overbought condition is released, the altcoin should jump to the March 9 high at $2.207, delivering a 26% gain from the current price.
Additional upside targets include the 0.618 and 0.786 Fibonacci retracement levels of the February-March bear market at $2.292 and $2.560.
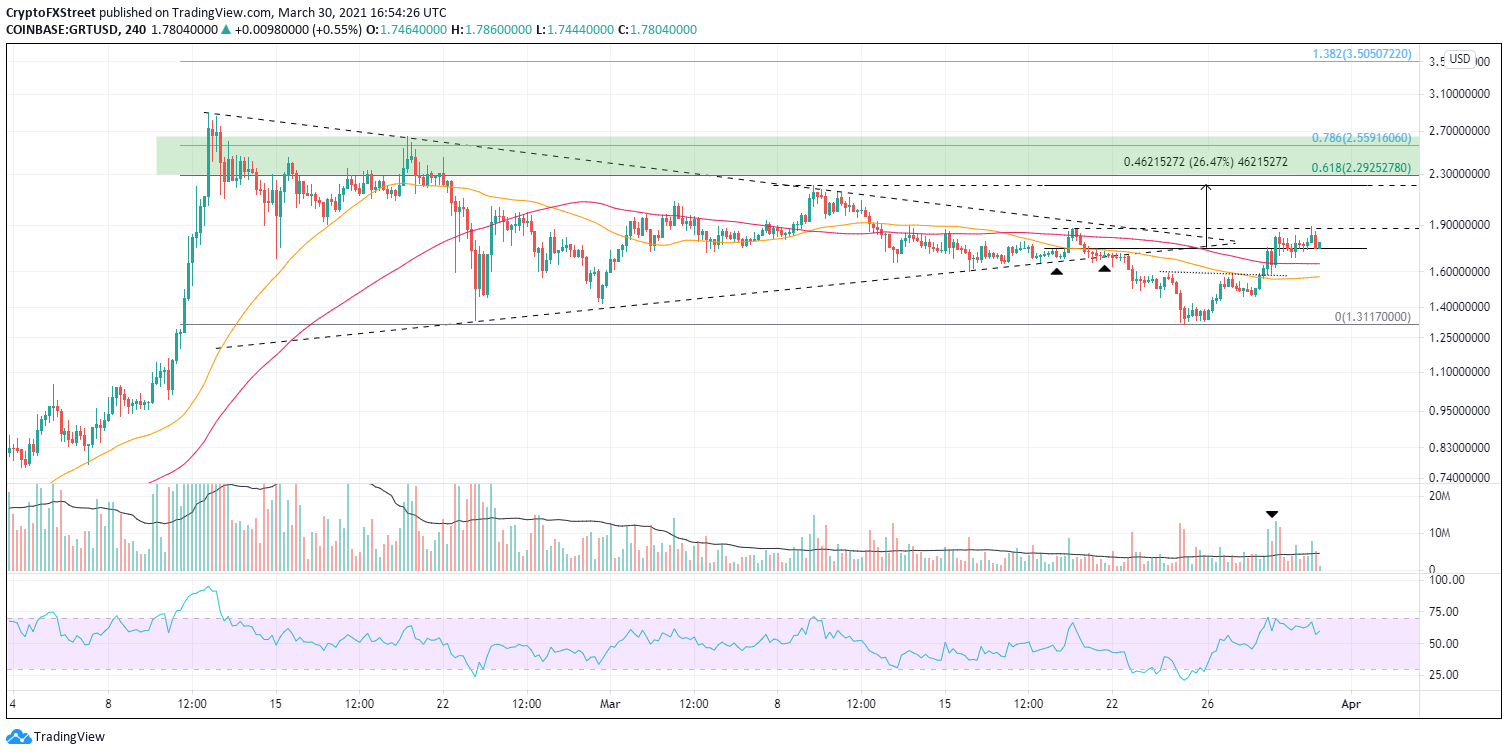
GRT/USD 4-hour chart
The support levels are the 100 four-hour SMA at $1.647 and then the 50 four-hour SMA at $1.569, followed by the February and March lows around $1.32. A failure to hold would raise the odds that GRT won’t test the all-time high for a long time.
