- The Graph price action is stuck between two crucial zones causing sideways movement.
- GRT’s recent upswing has resulted in tapping the upper trend line of an ascending parallel channel.
- As per transactional data, underwater investors around $2.33 might stunt any move to the upside.
The Graph price has seen a range-bound move since hitting a new all-time high in the previous rally. Although GRT vies to head higher, the supply zones present above will most likely halt it.
The Graph price attempts to escape sideways movement
The Graph price moves have been restricted between the supply zone ranging from $2.06 to $2.34 and the demand zone extending from $1.3 to $1.55. As a result, GRT is experiencing a choppy price action.
GRT has surged nearly 8.5% in the last 24-hours, which has pushed it into the supply zone. This advance has set up higher highs and higher lows, which results in an ascending parallel channel when connected with trend lines.
Due to the nature of the resistance posed by this area, the Graph price is likely to retrace 15% to the lower boundary of the channel, around $1.83.
A breakdown of the lower trend line at $1.83 could spell trouble for GRT holders as this would invoke a 12% pullback to $1.61 or a 20% crash to $1.44.
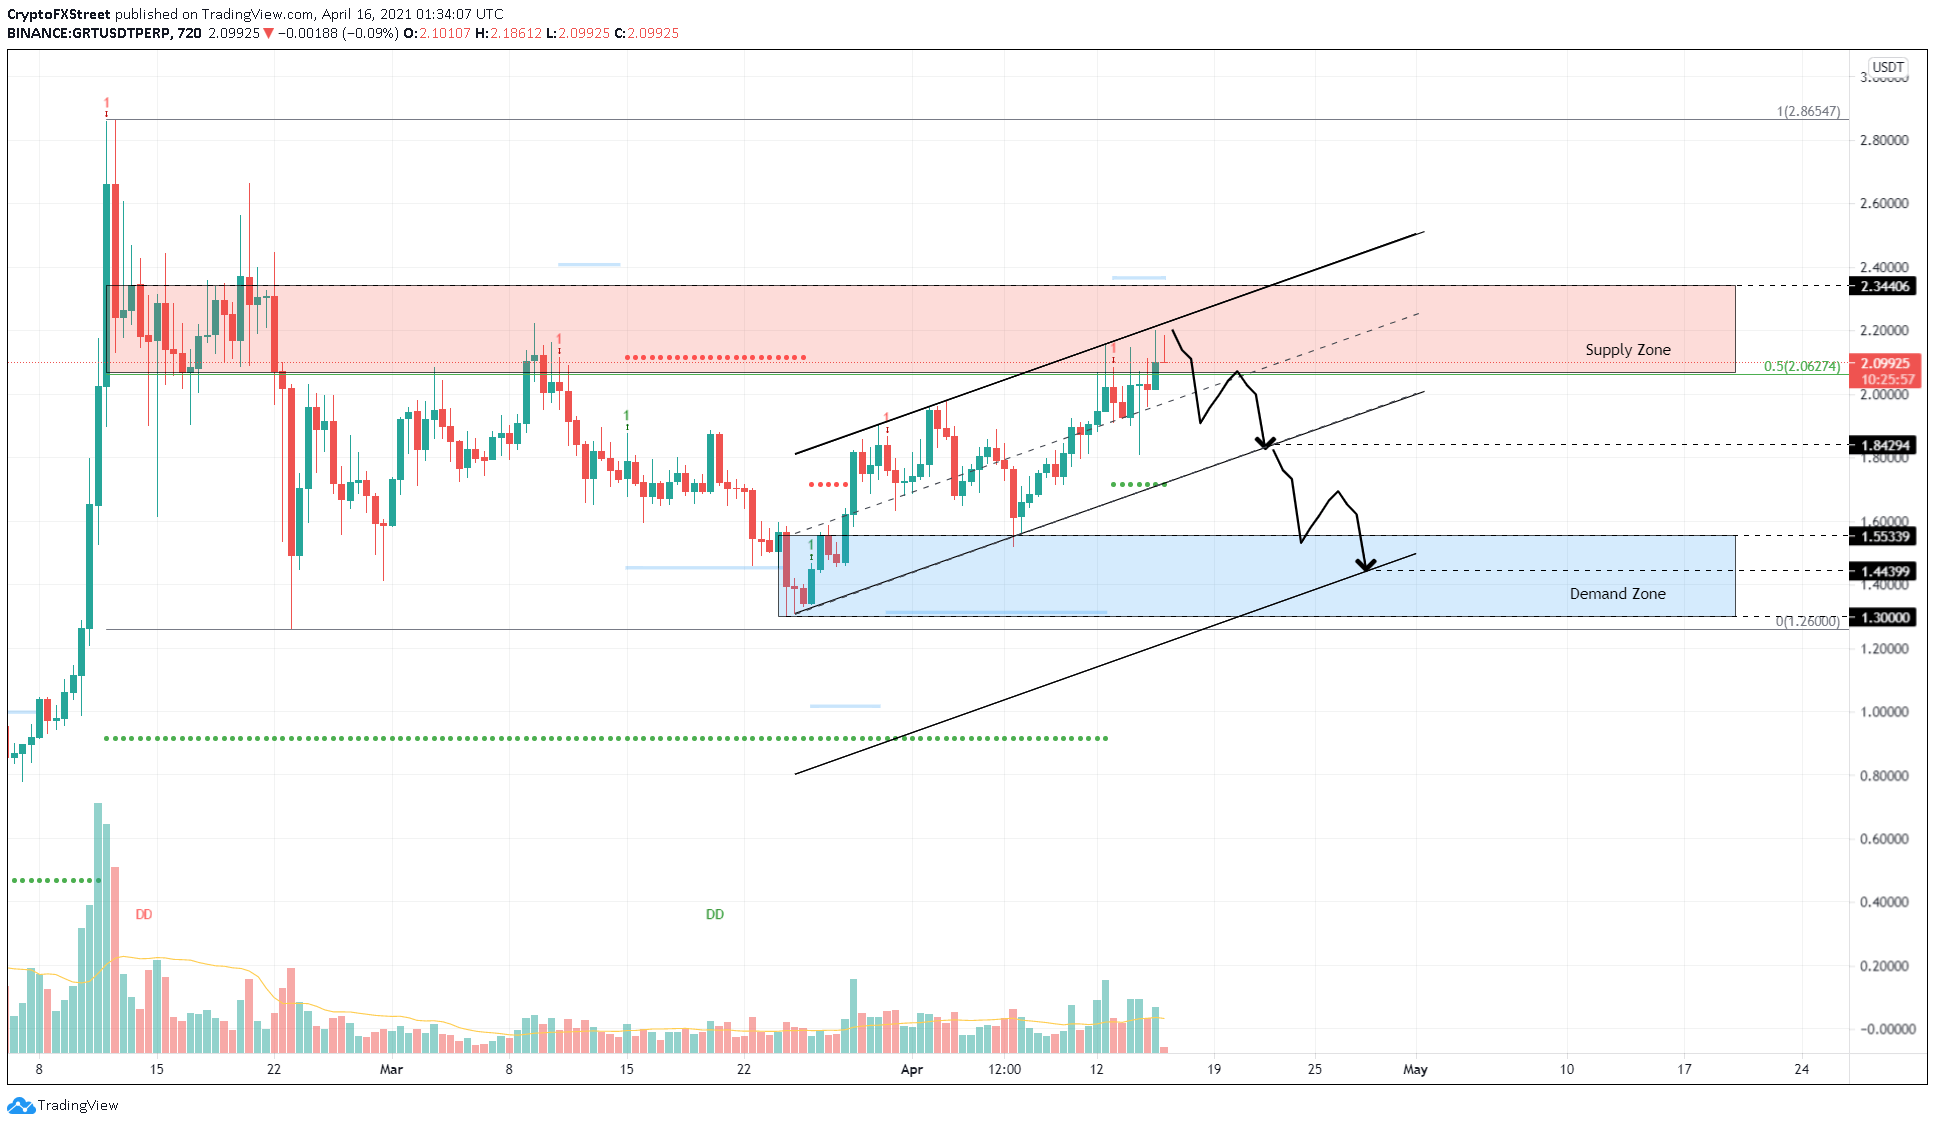
GRT/USDT 12-hour chart
According to IntoTheBlock’s In/Out of the Money Around Price (IOMAP) model, the concentration of “In the Money” investors triumph those that are “Out of the Money.” However, the 1,150 addresses that purchased 31.85 million GRT at an average price of $2.33 will be significant resistance that will prevent the Graph price advance.
A failure to breach this level could trigger a sell-off by investors who are likely to break even.
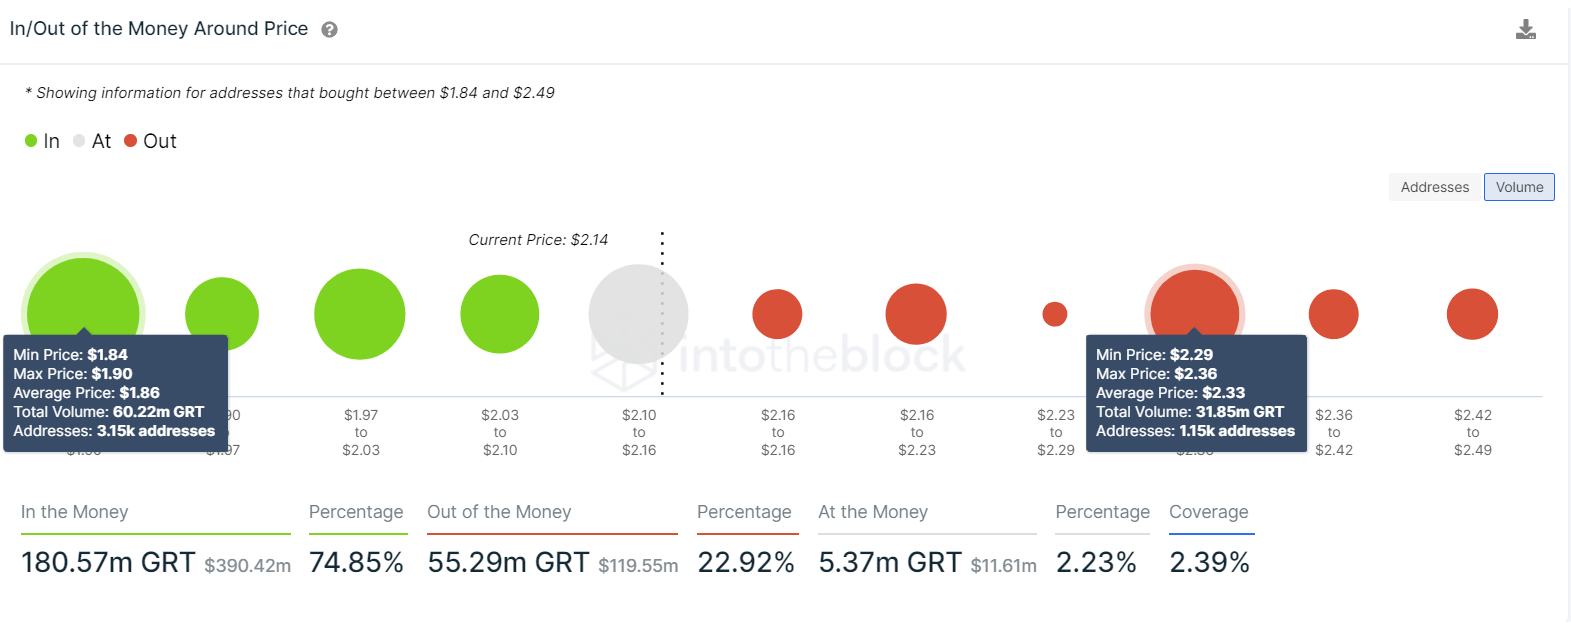
GRT IOMAP chart
Conversely, a bullish scenario will face invalidation if the Graph price moves beyond the supply zone’s upper boundary at $2.34 and produces a decisive 12-hour candlestick close above $2.40.
In such a scenario, investors could expect the bulls to retest the all-time high at $2.86.
