Today, the US celebrates Independence Day, so volatility is going to be much lower. Anyway the market waits for Friday’s job data. Since the 24th of June we are in a nice bullish pace, with only 2 correction days.
During the night Asia bounced back again: they are over 1% generally, Hang Seng +1,46%, and Sydney made +1,07%. The optimism was not seen in the Nikkei as it went down a bit. Everybody is keen on the nonfarm payrolls report on Friday, which will give us a clear indication of the market’s direction.
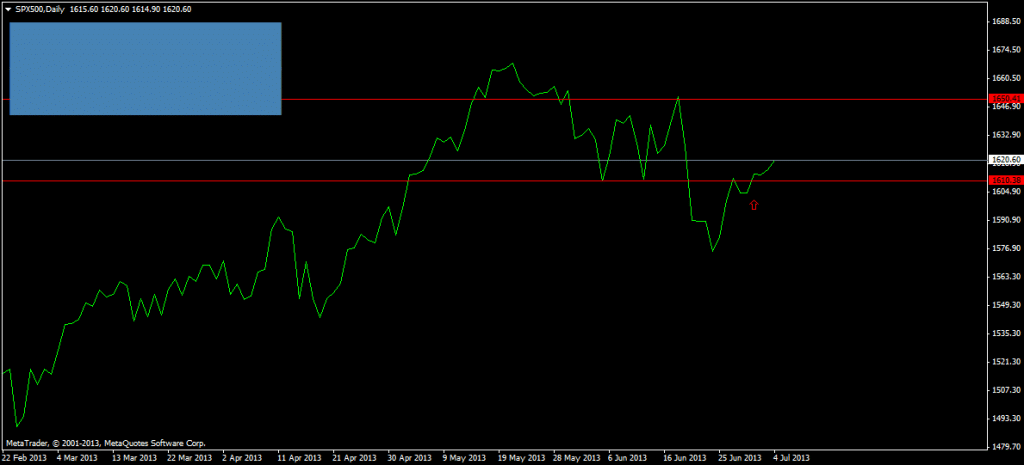
Technically the S&P500 made a break out on the daily chart: two days ago from the long term sell correction at 1610, now the road is paved to go up to 1650. This is the optimistic scenario, but my bet is that it is the realistic one.
Here are two pretty interesting charts from Barclays, about how bullish our markets have been in the last few years.
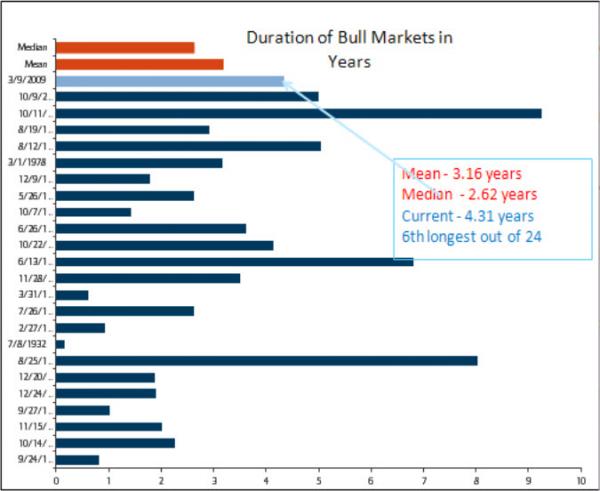
Since March 2009, S&P 500 made the 6th longest rally in the last 113 years, and made during this period a 127% gain.
The first chart is about how long our current bullish rally is:
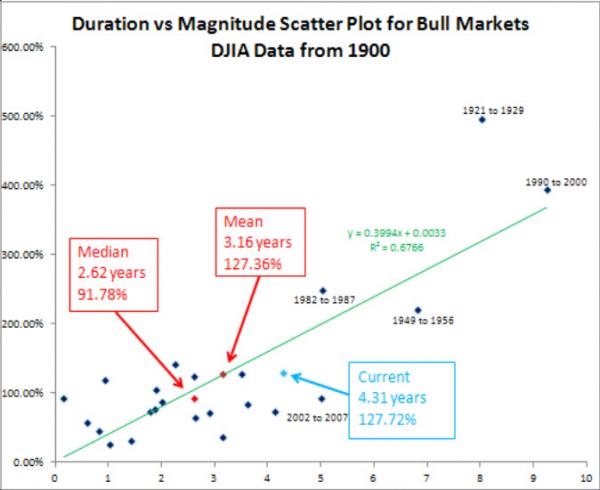
The second chart about the performance: