- The CBOE volatility index (VIX) is 3.68% lower as equities push higher on Tuesday.
- The Nasdaq is 1.43% higher as the tech sector outperforms once again.
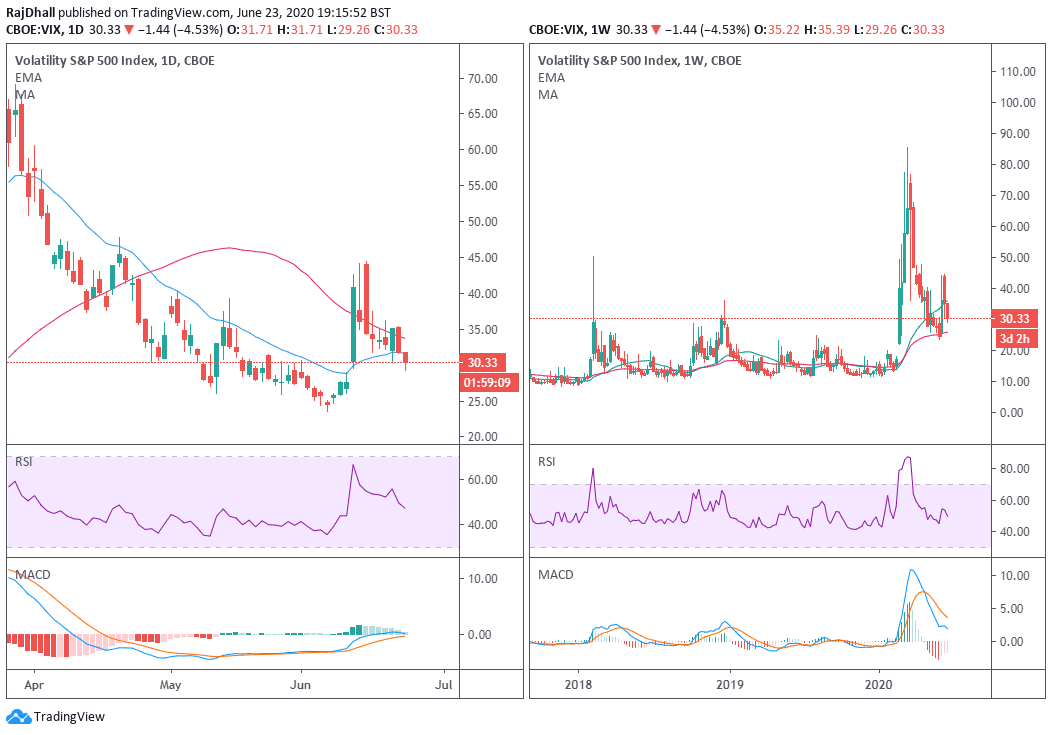
The indecies look to be aligning with thier recent upward trend on Tuesday and the VIX is still recovering from the spike seen on 16th March. This was when the index reached a high of 83.56 and now it index is moving to more normal levels. If the VIX is anything to go by it seems the bulls have won the battle in the equity markets. The fact that the price has printed below the low of two sessions ago at 30.40 is important. At the moment it seems the index has moved momentarily back up but the close will be important.
VIX daily chart (left) and weekly chart (right)
Looking at the technicals, the daily MACD is now aligning with the weekly MACD on the right. Soon both histograms could both be below the zero lines. The key psychological level at 30.00 was broken momentarily but subsequently, the price moved back up. On the weekly chart on the right, you can see the market is moving closer to the historical range under the 20 mark. This is where it could be confirmed the US bourses are in full swing bullish mode. Both Relative Strength Index indicators are under the 50 mid-point. This is also another bullish signal and the coming days will tell us lots about what could be in store in the future.