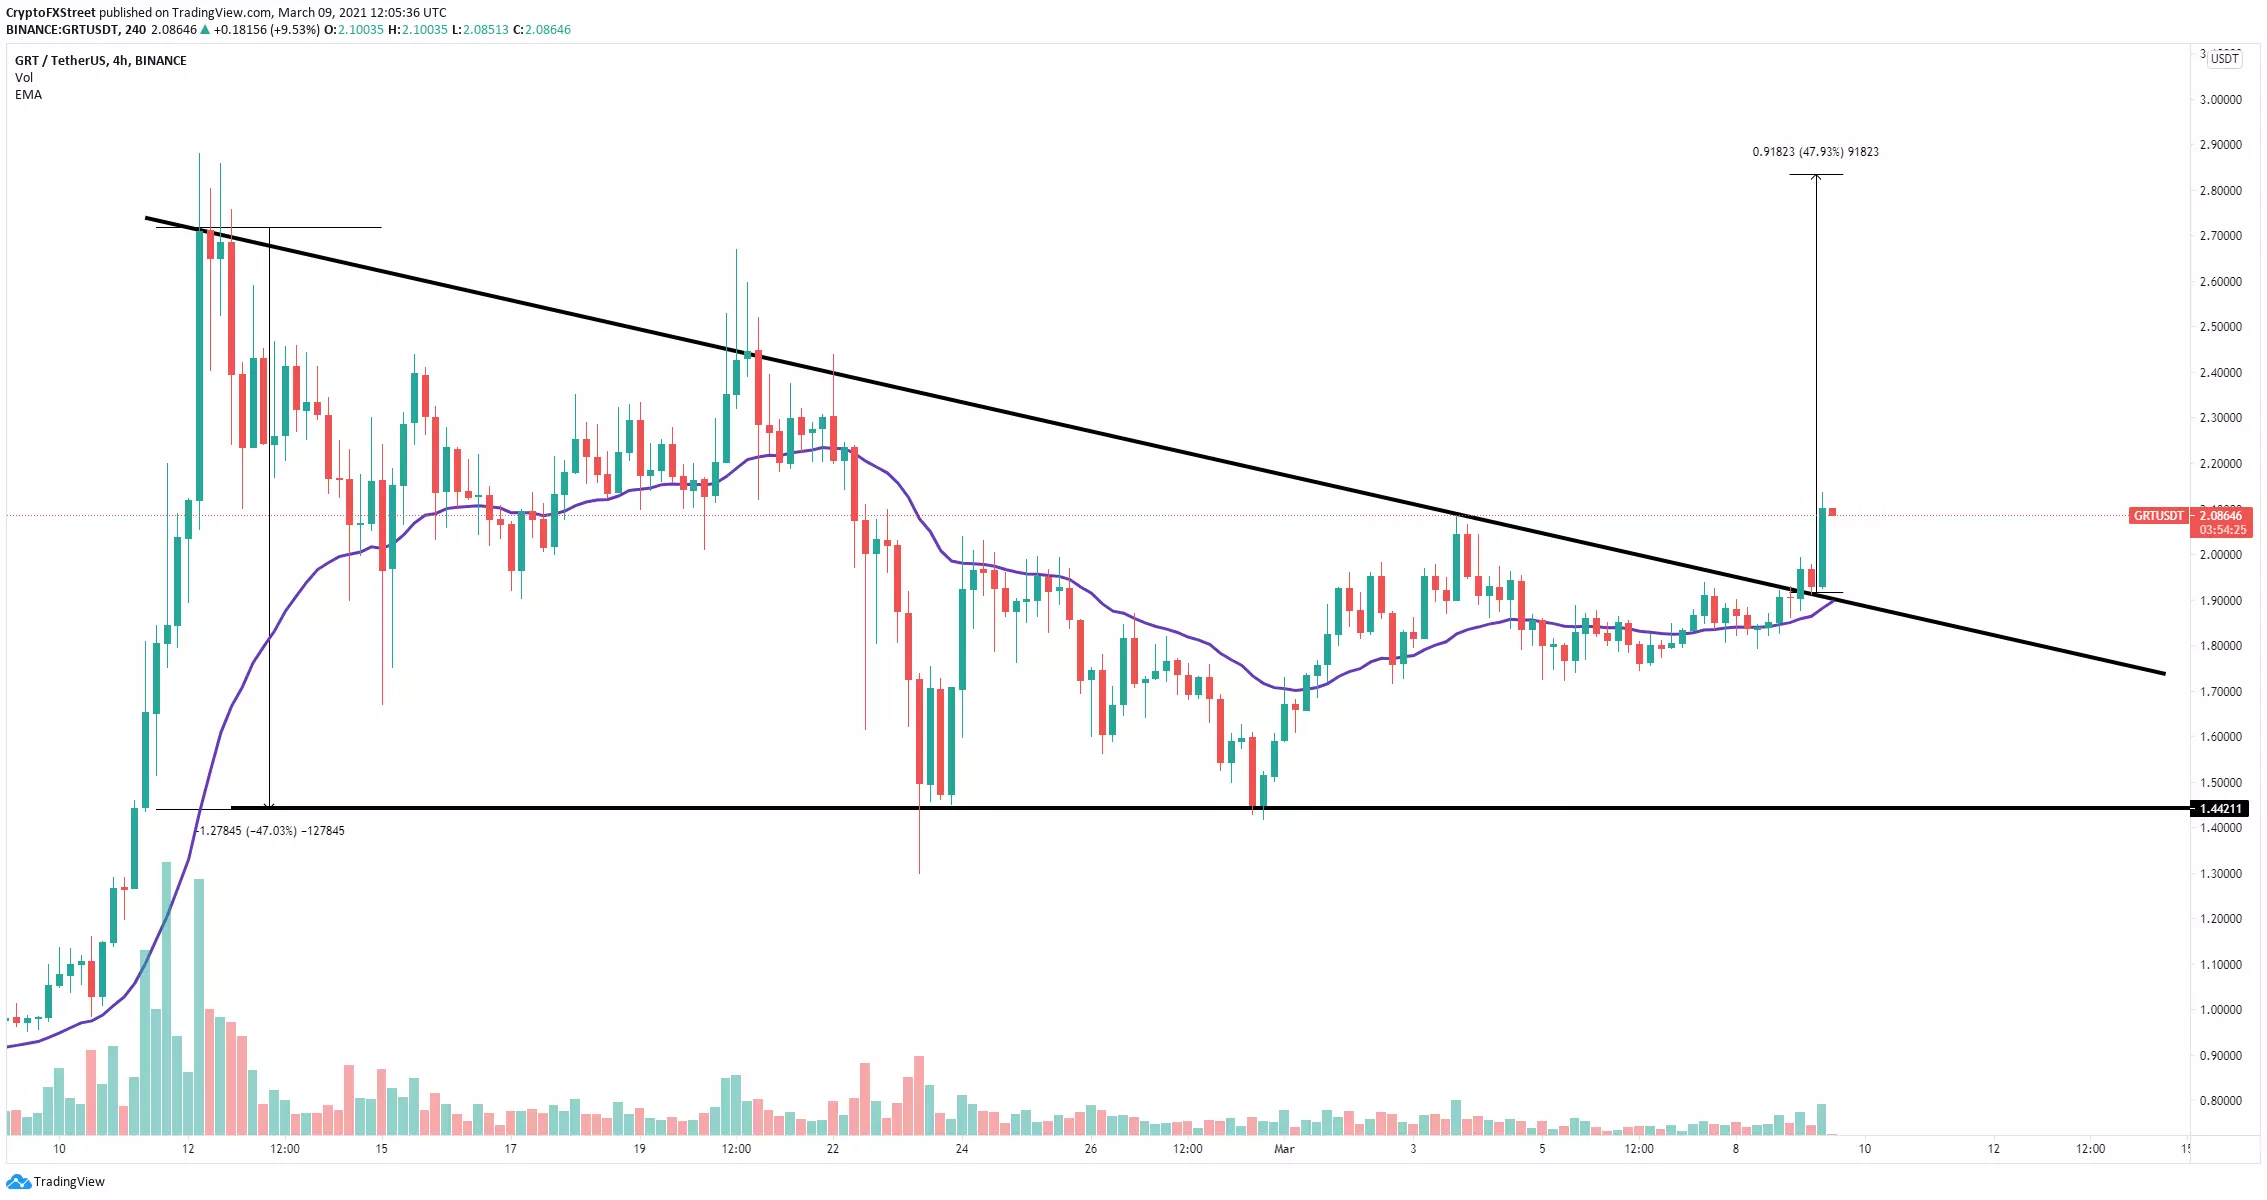
- TheGraph price was contained inside a descending triangle pattern.
- The digital asset has clearly broken out of the pattern which has a target of $2.8.
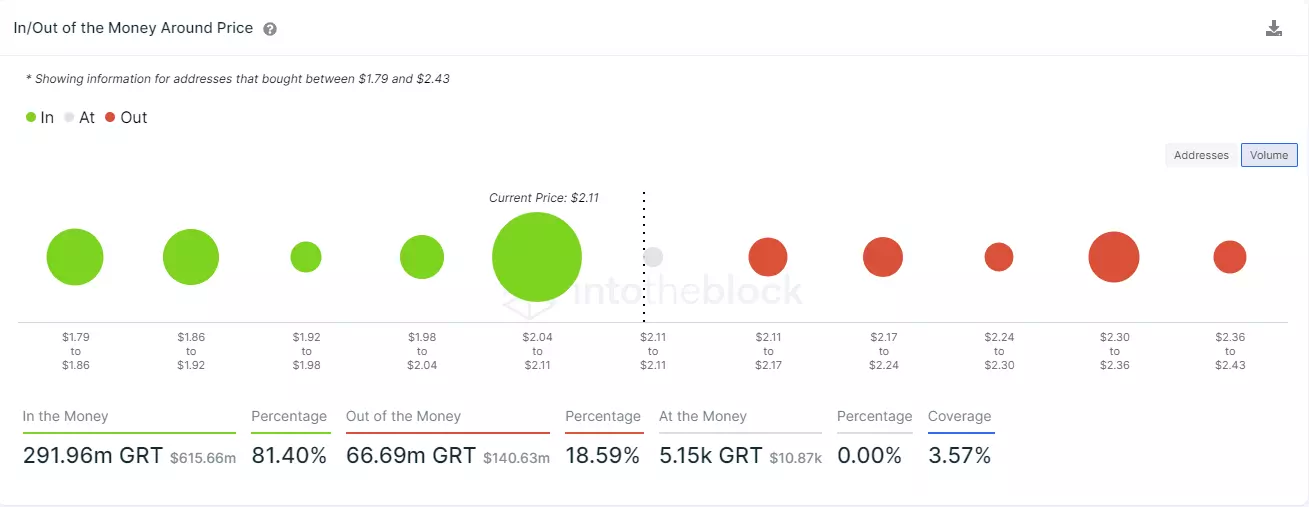
- GRT faces weak resistance above $2.1 despite whales selling.
TheGraph price had a significant 10% breakout from a key pattern on the 4-hour chart and aims for a long-term target of $2.8. There is barely any resistance above this point which means GRT will quickly rise.
TheGraph price should quickly rise towards $2.8
On the 4-hour chart, GRT saw a significant breakout above a key resistance trendline part of the descending triangle pattern. The price target is all the way up at $2.8 as bulls have also reclaimed the 26-EMA support level.
GRT/USD 4-hour chart
According to the In/Out of the Money Around Price (IOMAP) chart, there seems to be fairly weak resistance above $2.1. The most significant area is located between $2.3 and $2.36 where 1,330 addresses produced 32.68 million GRT in volume.
GRT IOMAP chart
The only concerning trend for GRT is the selling pressure coming on from whales. Since December 24, 2020, whales holding between 1,000,000 and 10,000,000 coins have been selling a lot. In the past week alone, the number of these large holders dropped by 13, which is significant.
GRT Holders Distribution
This factor could drive TheGraph price down to the previous resistance trendline, currently at $1.88 for a re-test.


%20%5B13.07.57,%2009%20Mar,%202021%5D-637508891869963883.png)
