- TheGraph price is contained inside a descending triangle pattern on the 4-hour chart.
- The digital asset faces significant selling pressure from large holders.
- Bulls have the chance of pushing GRT by 50% if they crack key resistance level.
TheGraph has been under consolidation since its all-time high of $2.88 on February 12. Many large whales have sold some of their GRT holdings, increasing the selling pressure of the digital asset.
TheGraph price faces strong selling pressure in the short-term
On the 4-hour chart, TheGraph price is right at the top trendline of a descending triangle pattern. Rejection from the key resistance level of $2 will quickly drive GRT down to the lower boundary of the pattern at $1.44.
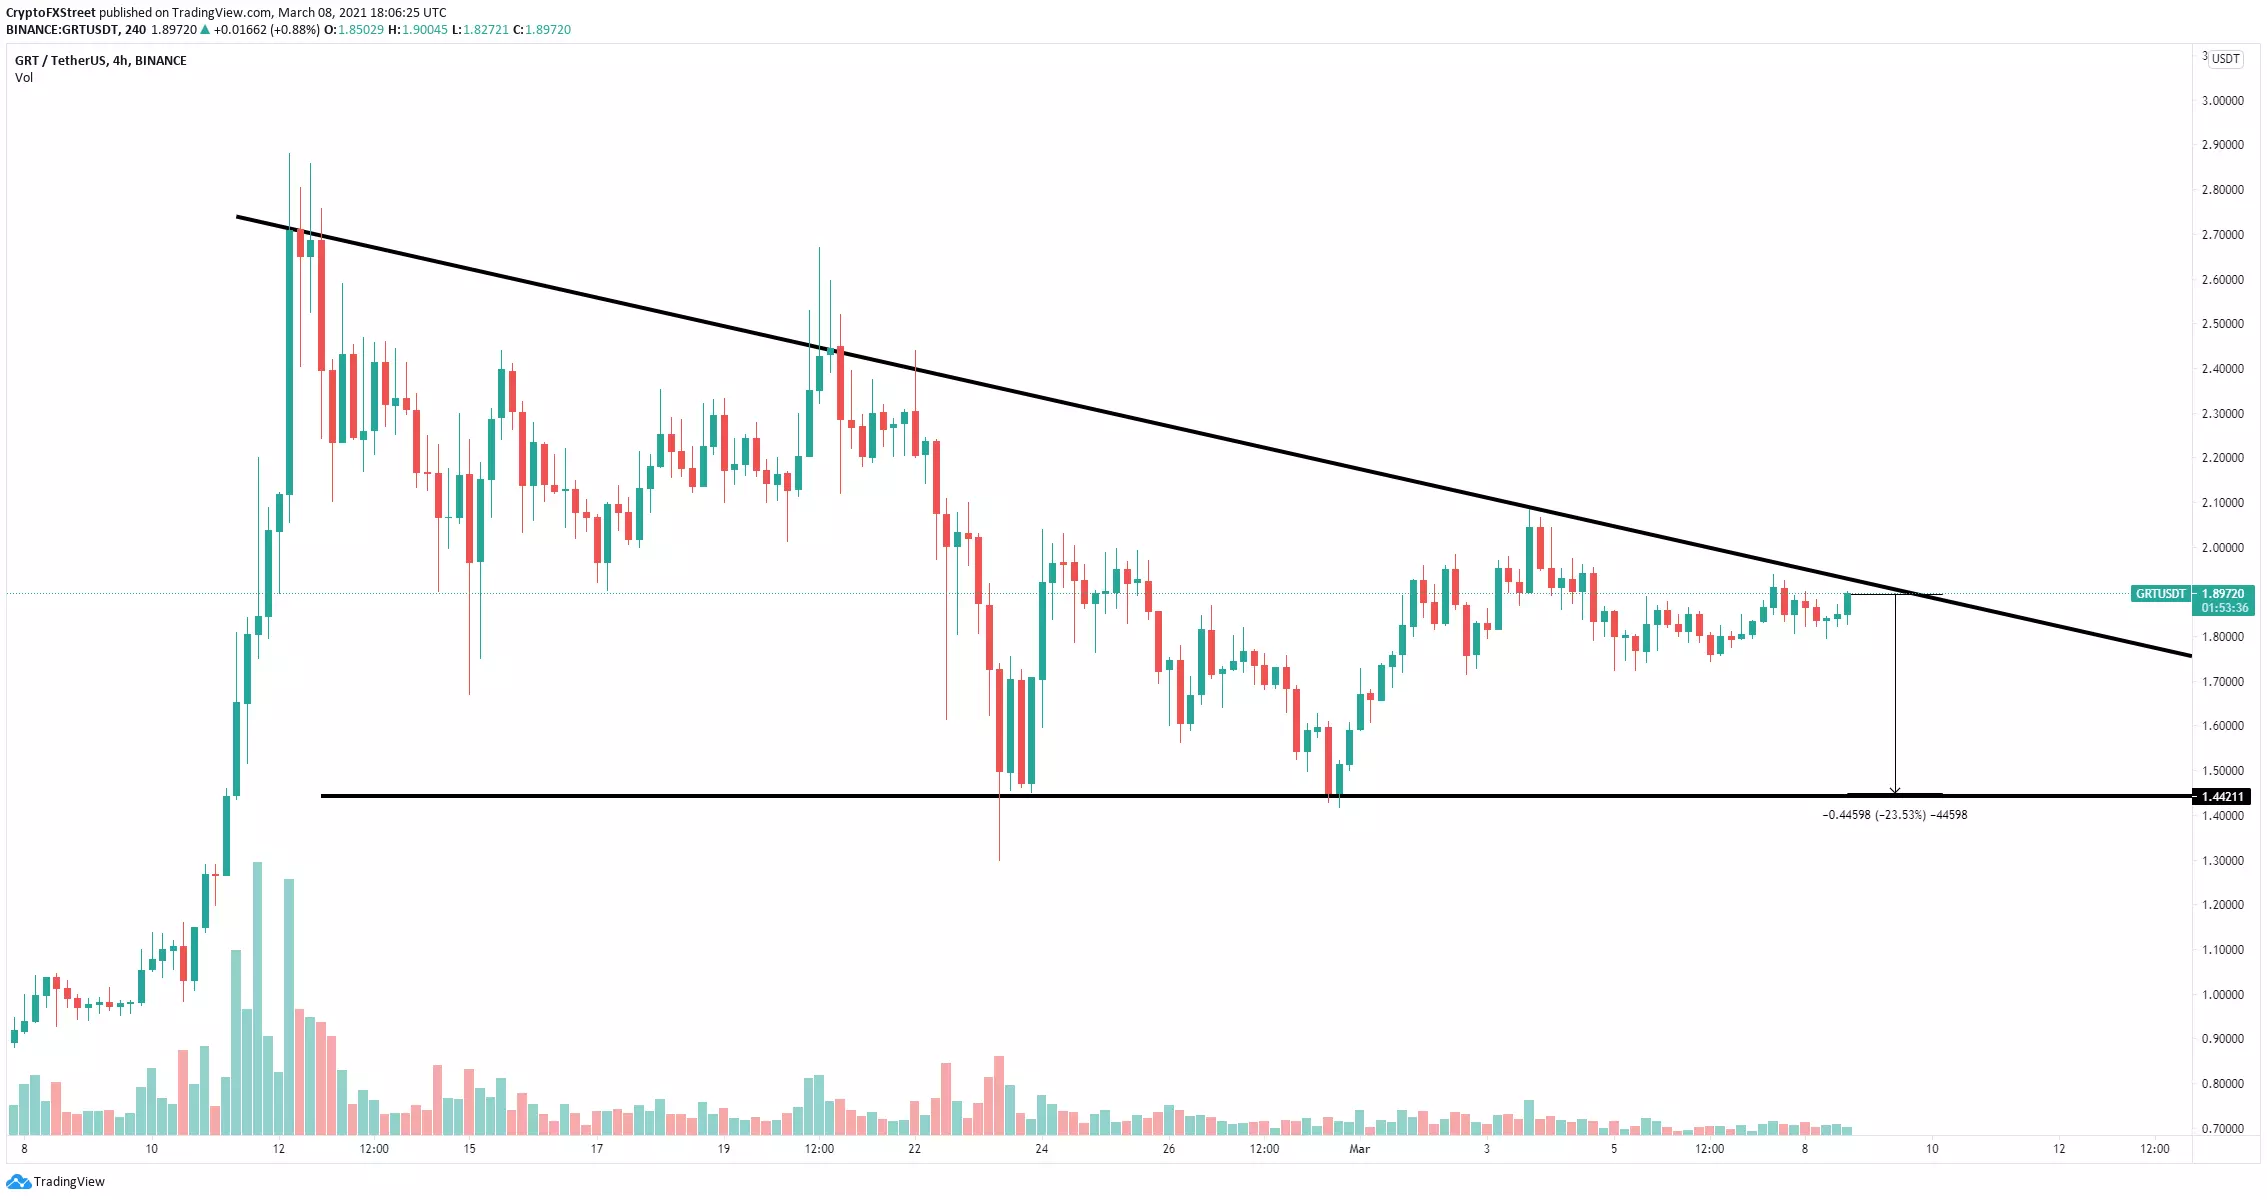
GRT/USD 4-hour chart
Additionally, the number of whales holding between 1,000,000 and 10,000,000 GRT coins ($2,000,000 and $20,000,000) has dropped by nine in the past week, significantly adding selling pressure to the network.
%20%5B19.06.43,%2008%20Mar,%202021%5D-637508238788578409.png)
GRT Holders Distribution chart
However, the current price of GRT is extremely close to the key resistance trendline of $2. A breakout above this point will drive TheGraph price towards its previous all-time high.
