- Theta is currently trading at $0.533, and it’s getting close to the all-time high at $0.589.
- Theta’s trading volume has been slowly declining over the past 30 days.
Theta had a major bull rally, well before any of the more prominent names did. The digital asset saw a 1,540% price increase from March’s low to the peak by the end of May. The $0.589 level remained as the most critical resistance level and was re-tested on August 24.
THETA/USD daily chart
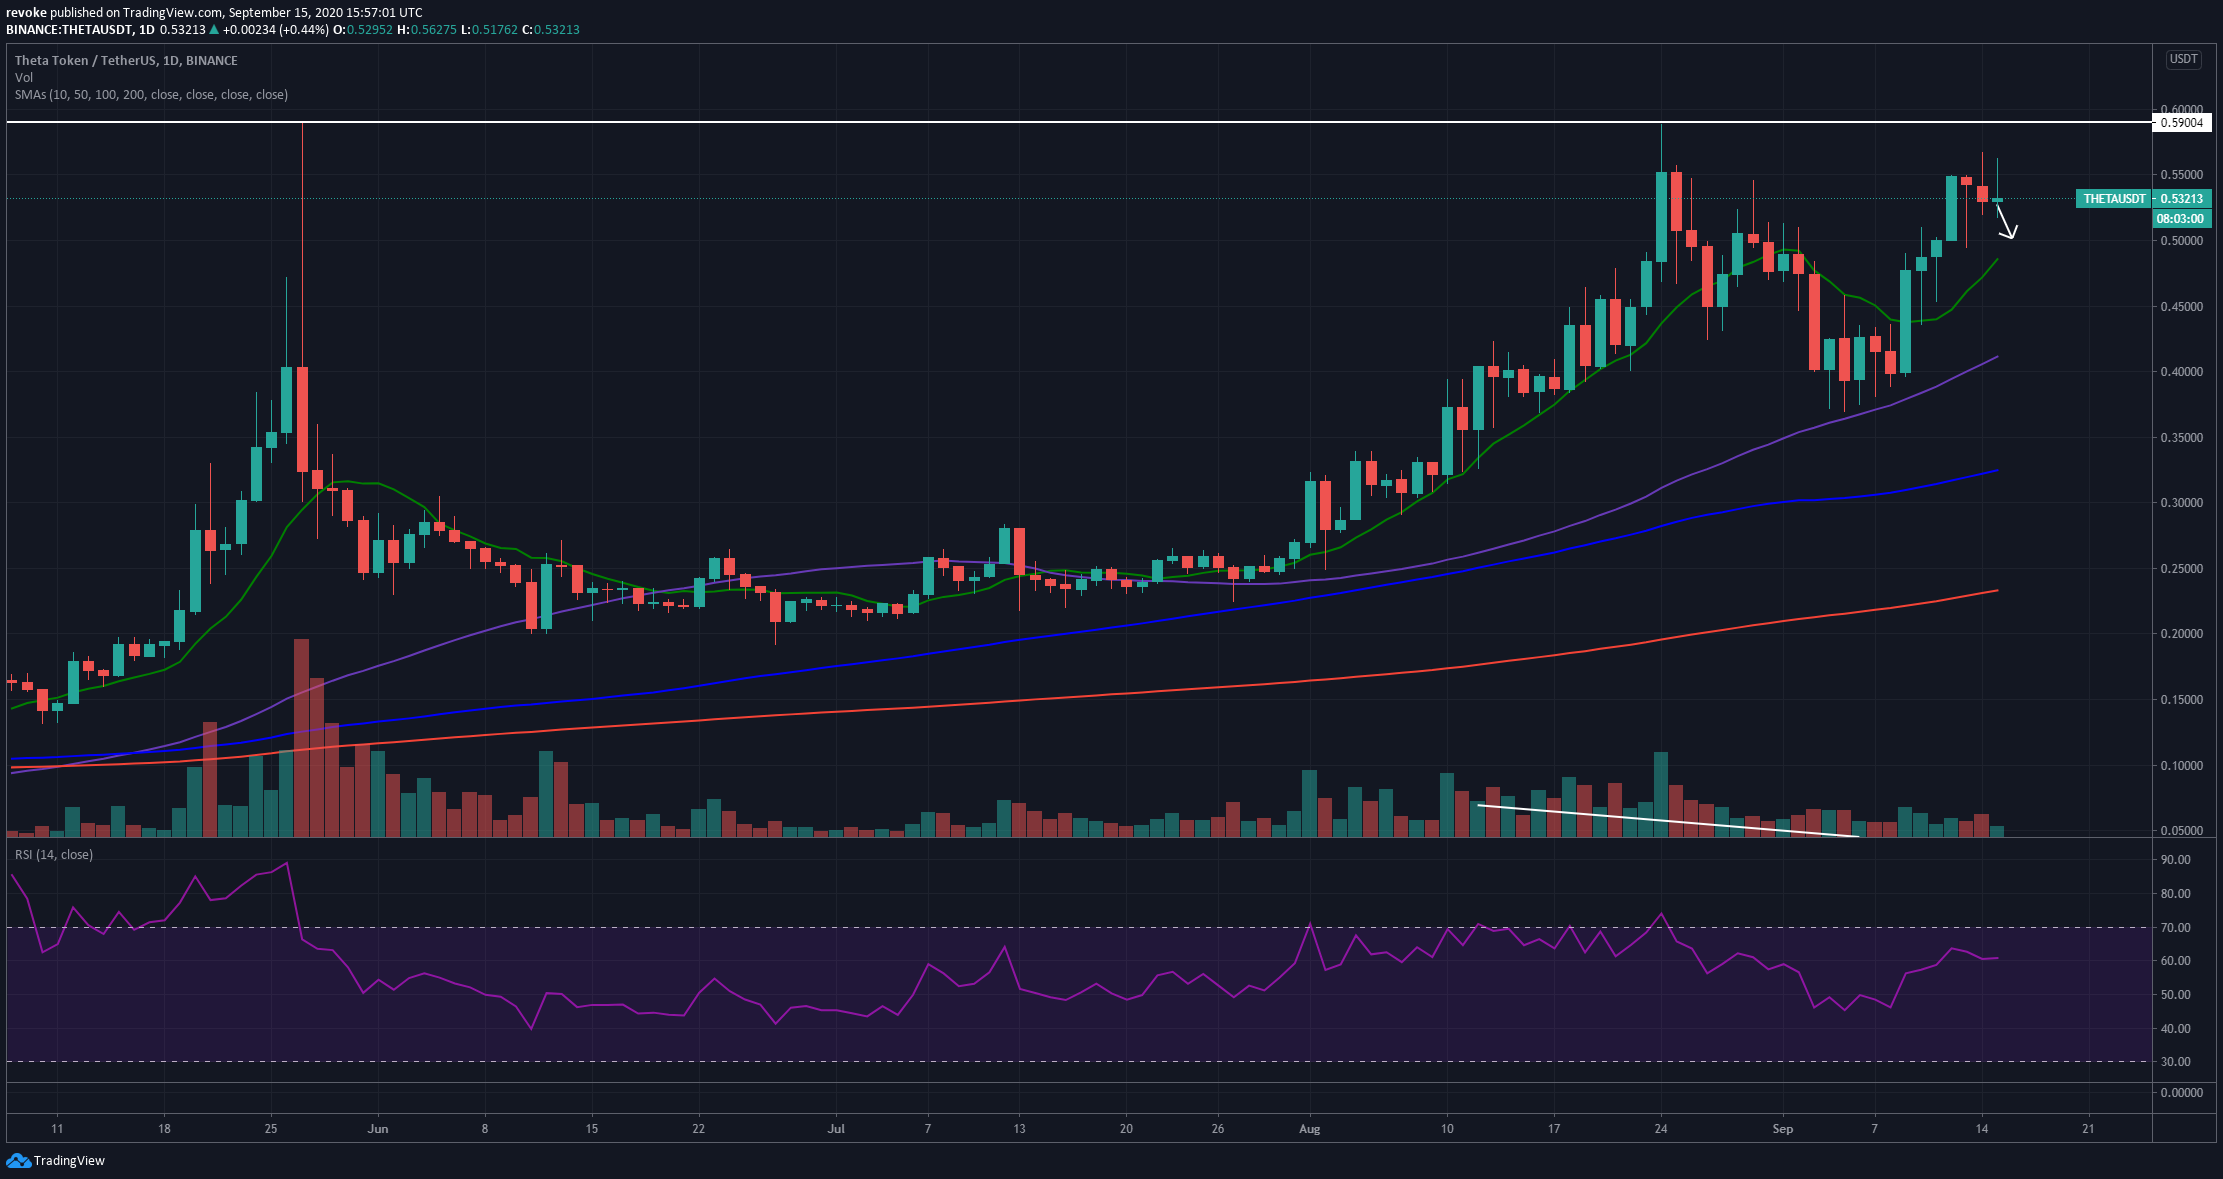
After re-testing the critical resistance level at $0.589, bulls are currently pushing Theta towards it again. The initial rejection on August 24 took Theta down to $0.37, but the price managed to bounce back up above the 10-SMA.
Theta’s price is currently retracing from $0.549 and could continue pulling back until meeting with the 10-SMA like in the past before the next leg up. The trading volume of Theta across all exchanges has been dropping since August 26. The price has been going up since September 5, but trading volume hasn’t, this could indicate that bulls are weaker than it seems in the long-term.
THETA/USD 4-hour chart
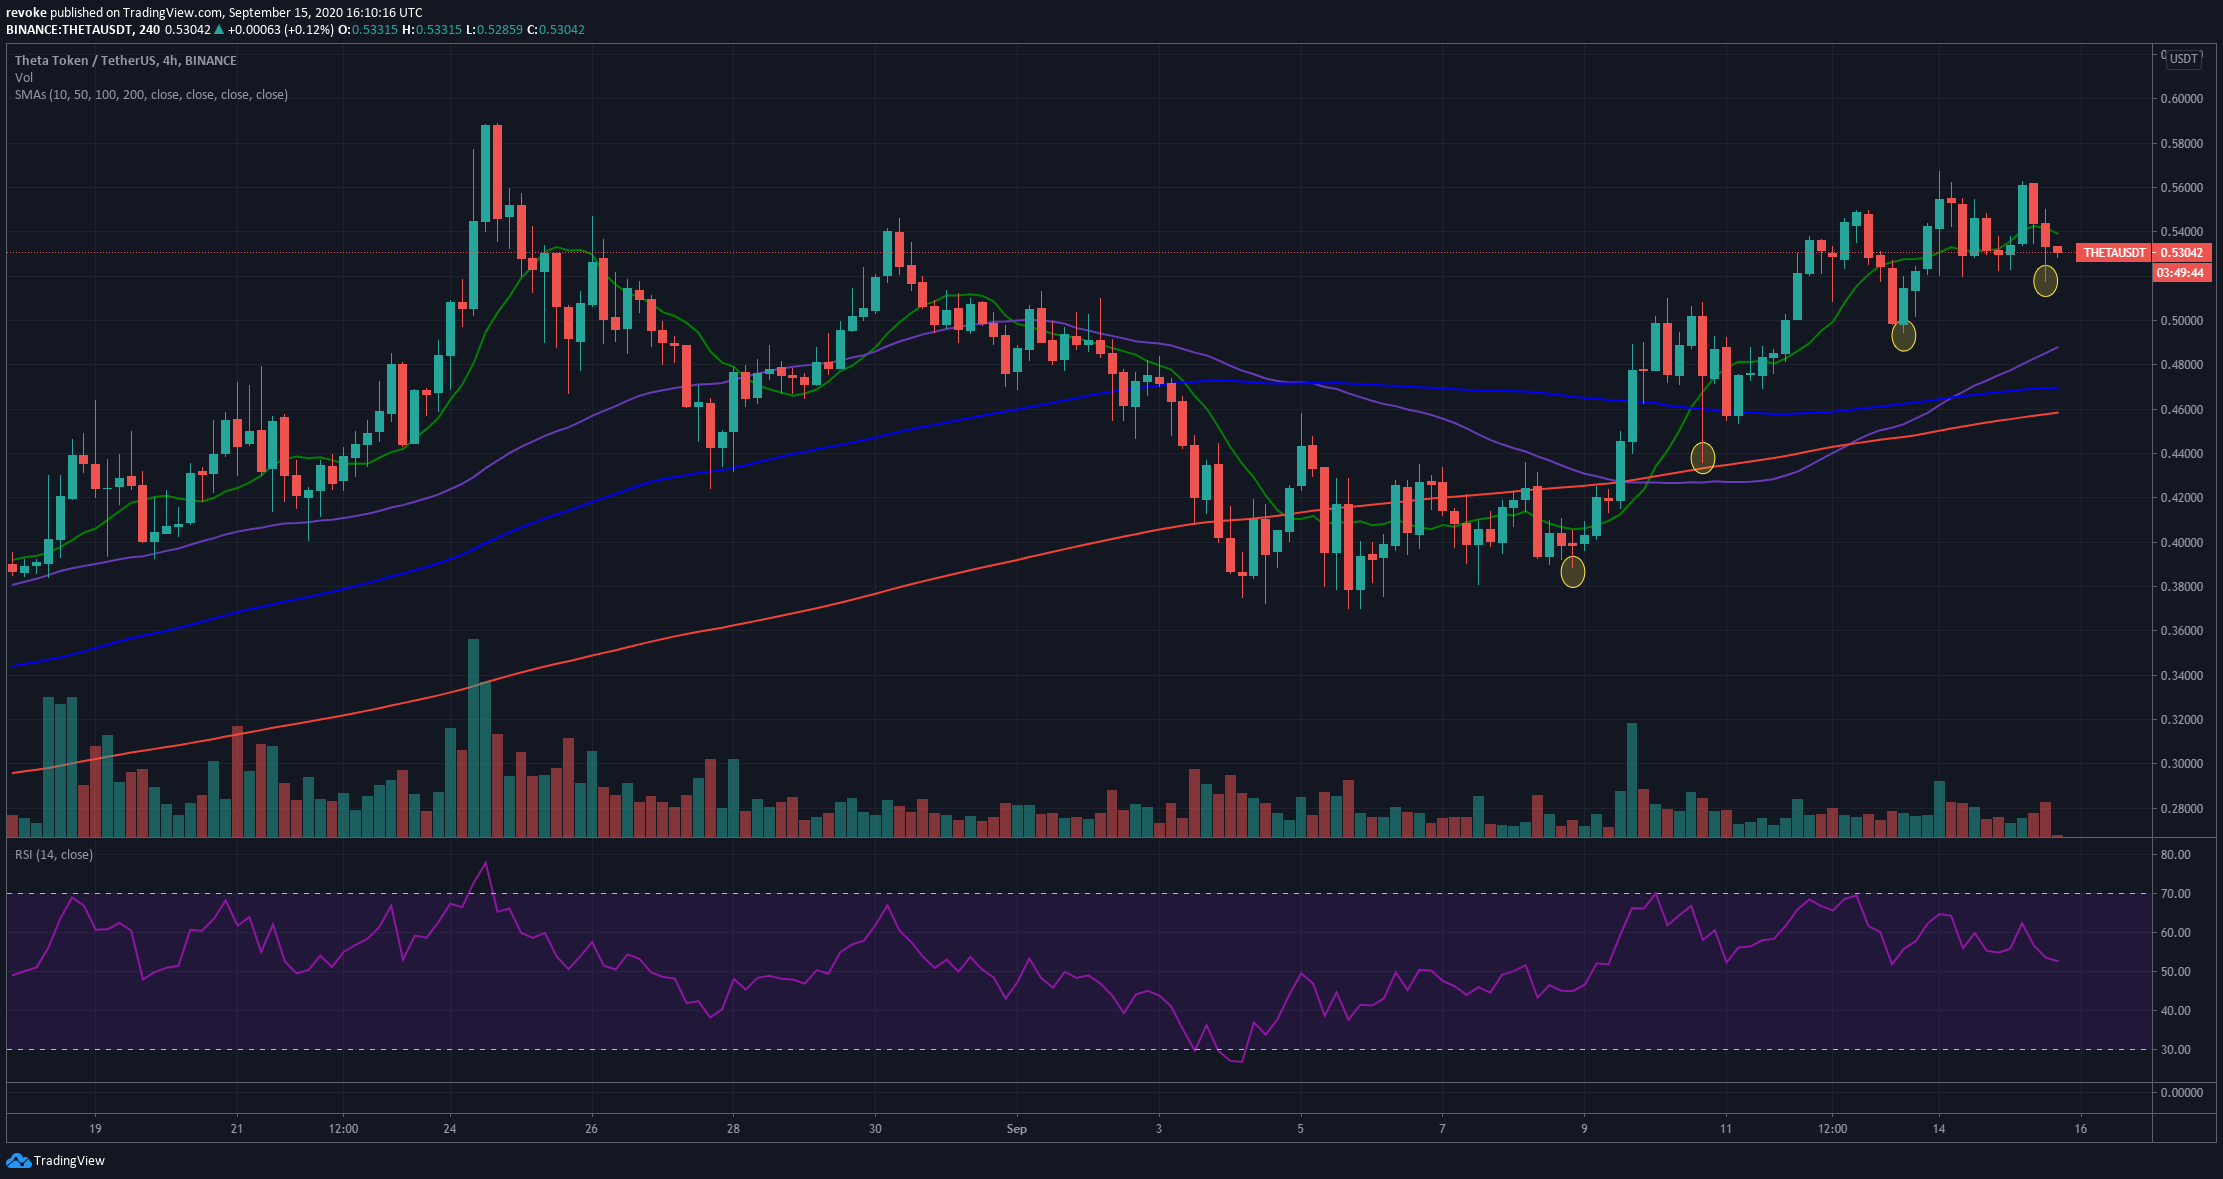
There are certainly no red-flags in the short-term for Theta as the digital asset has clearly established several higher lows creating a strong uptrend.
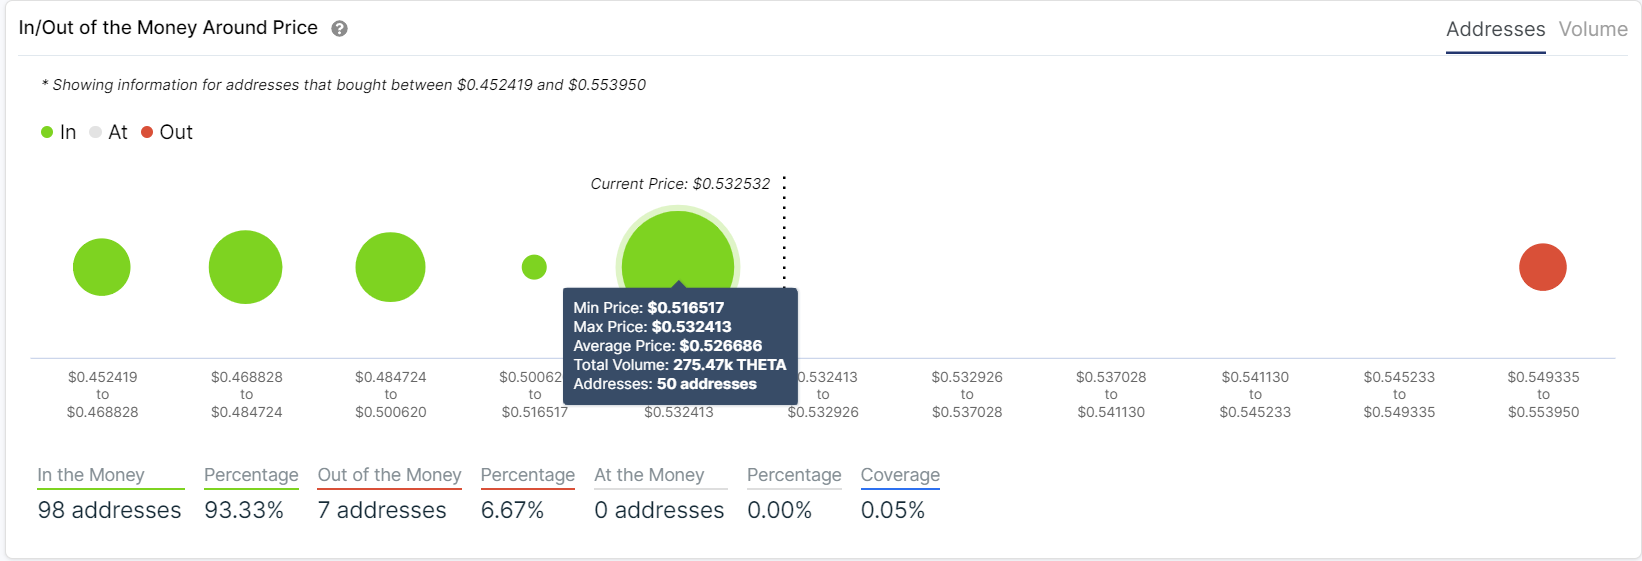
IOMAP Theta chart
The IOMAP chart also seems to be absolutely in favor of the bulls as there is a strong support level at $0.532 and almost no resistance at $0.5539 or above. However, strong support doesn’t equate a breakout, and the lack of trading volume could be concerning to investors looking to enter long positions.
