- The charts clearly show a bullish profile in Ether that is not seen in the Bitcoin.
- XRP also shows non-existent downward signs in Ether and other members of the ERC-20 family.
- Once the panic of selling has passed, positioning in assets with potential returns.
The momentary calm arrived in the financial markets yesterday with the announcement of coordinated financial support operations by the central banks.
Last week the sell-off was widespread and impacted all assets except for bonds.
The general view is that investors liquidated many positions to cover “margin calls” on leveraged upside positions.
When this hedging process is complete, capital flows will again make a difference between assets. Some will continue to fall; others could have sharp rises.
The technical charts show clearly the differences between the falls in the global markets and the views in gold or Bitcoin. Vertical declines in equities herald further decreases in the future. Future scenarios are not very positive.
In the case of Bitcoin and gold, the structures are of the consolidation type, less vertical, more orderly and easily recoverable for the upward cause.
Within the crypto segment, there are also differences in the technical landscape as we see today in the detailed analysis.
A fact that reinforces this positive scenario for Bitcoin is the new record high achieved in the installed Hashrate. The miners are expecting higher prices and are working hard to put all the available computing power to mine.
Today’s session shows increases along with the crypto board, with BitcoinSV leading the gains between the Top 10 (+5.19%) and Tezos as the negative note (-0.31%).
ETH/BTC Daily Chart
The ETH/BTC pair is currently trading at a price level of 0.02594, showing great resilience on the part of the Ether to global sell-off.
The price remains in the high consolidation range, and it is the moving averages that are accelerating to reach the spot price level.
Above the current price, the first resistance level is at 0.0268, then the second at 0.0278 and the third one at 0.029.
Below the current price, the first support level is at 0.025, then the second at 0.0236 and the third one at 0.023.
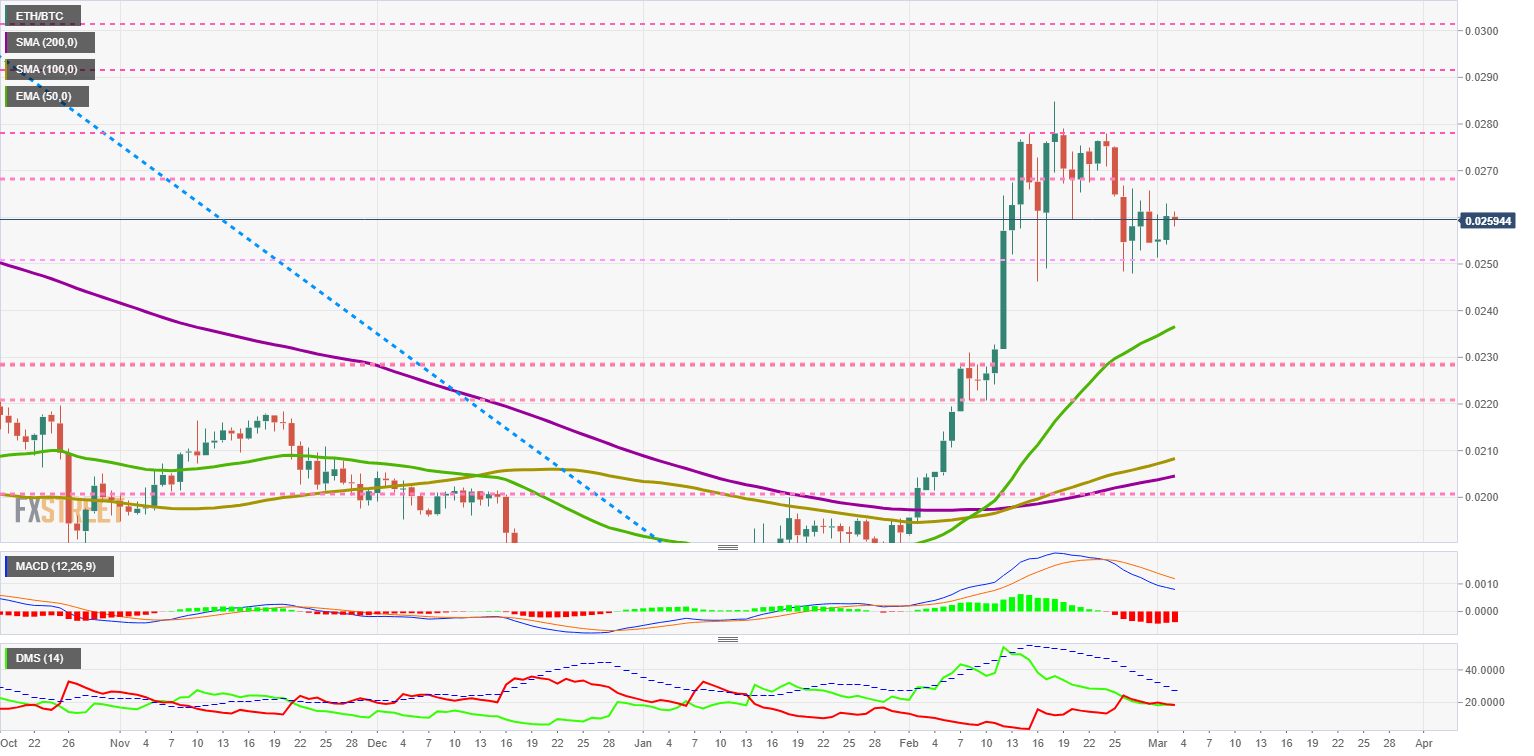
The MACD on the daily chart continues to cross the lower border of the chart, but the bearish trend is still intact. It is important to note that the moving averages continue to be at very high levels of the indicator.
The DMI on the daily chart shows a critical point of balance between bulls and bears. The resolution of this parity will be significant for the price development in the short and medium-term.
BTC/USD Daily Chart
BTC/USD is currently trading at $8802 and finds support above the SMA200 recovered yesterday.
The main moving averages show mixed development, with the EMA50 and the SMA200 sloping lower and the SMA100 rising.
Bitcoin’s consolidation structure is deep and its situation, in the middle of the moving averages’ network, promises difficulties to find a clean scenario.
Above the current price, the first resistance level is at $8800, then the second at $9180 and the third one at $9625.
Below the current price, the first support level is at $8400, then the second at $8200 and the third one at $8000.
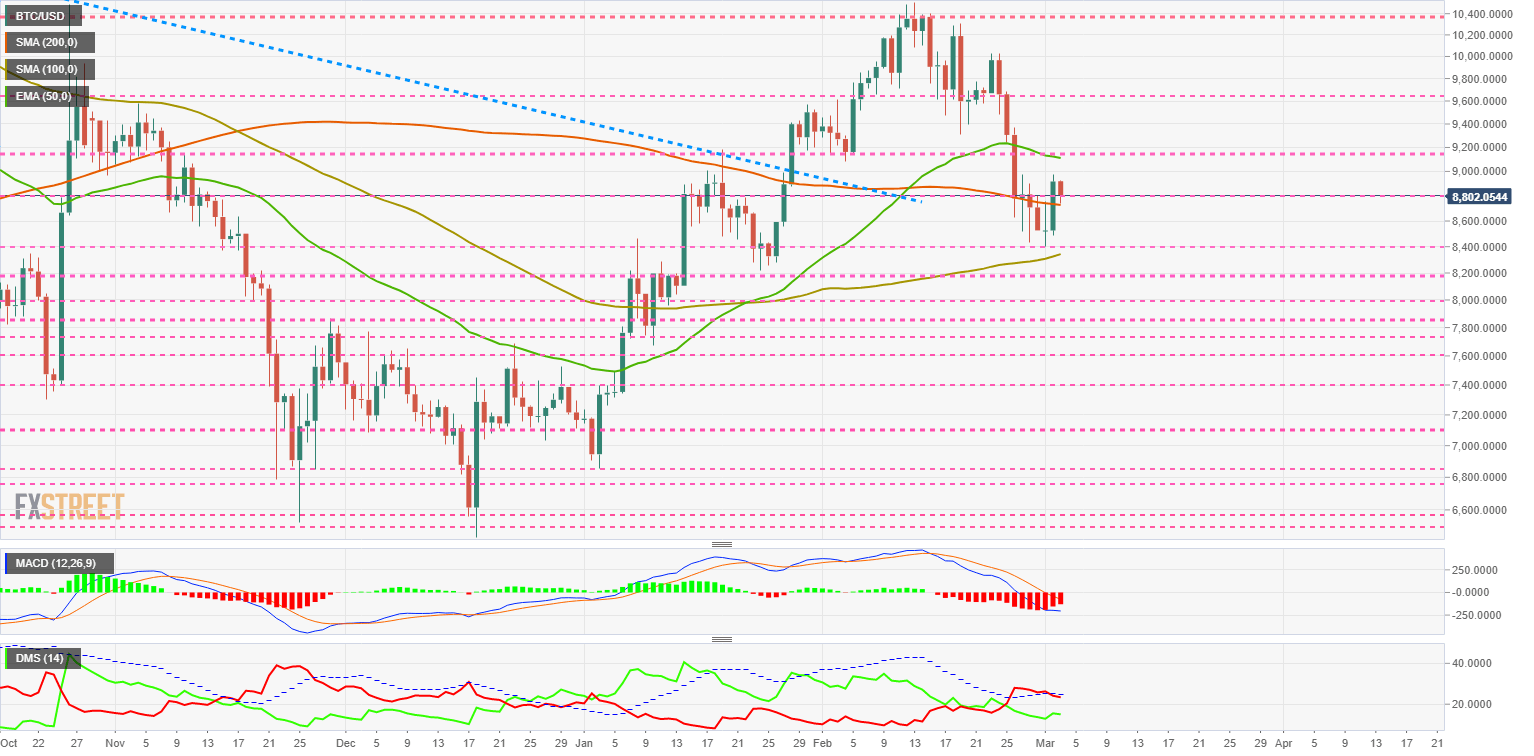 The MACD on the daily chart is decreasing the bearish profile, but it is already within the bearish zone of the indicator. A possible upward shift will have the opposite of the 0 levels in the transition to the bullish zone.
The DMI on the daily chart shows bears dominating the pair but losing support from the ADX line. The bulls see an opportunity in the current rise and increase the activity level.
ETH/USD Daily Chart
ETH/USD is currently trading at $228.6 and is holding steady above the EMA50.
All of the moving averages on the Ether chart show a significant upward profile.
Ether has no moving averages to move up and shows a very positive consolidation structure for the short and medium-term.
Above the current price, the first resistance level is at $235, then the second at $246 and the third one at $260.
Below the current price, the first support level is at $225, then the second at $215 and the third one at $209.
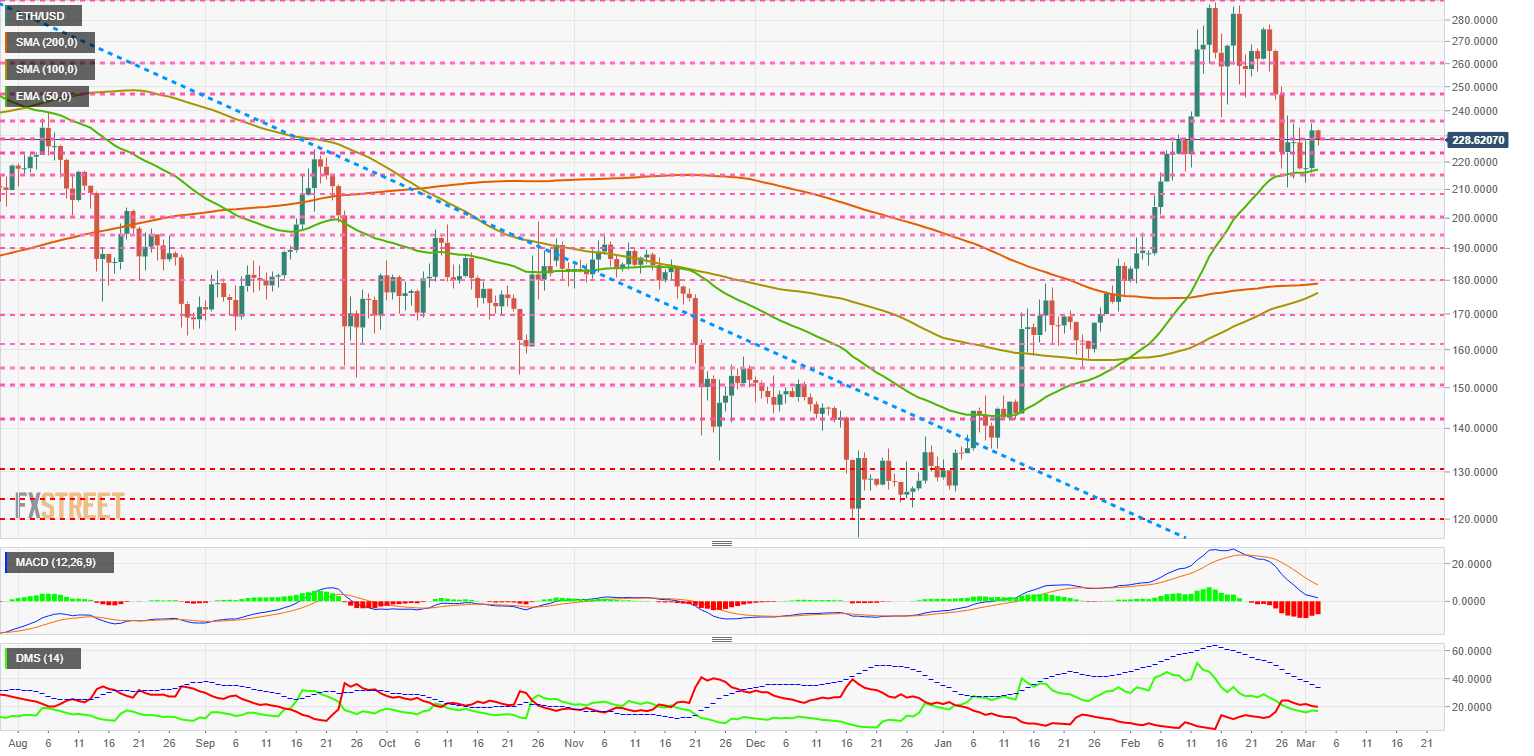 The MACD on the daily chart shows an improvement in the profile, reflecting the current consolidation, non-liquidation, momentum.
The DMI on the daily chart shows the bears sending the pair to the lows. Bulls could easily take over if sales accelerate.
XRP/USD Daily Chart
XRP/USD is currently trading at the price level of $0.235, supported by the SMA100. The main moving averages show a flat profile – slightly bearish.
Above the current price, the first resistance level is at $0.24, then the second at $0.252 and the third one at $0.268.
Below the current price, the first support level is at $0.22, then the second at $0.21 and the third one at $0.20.
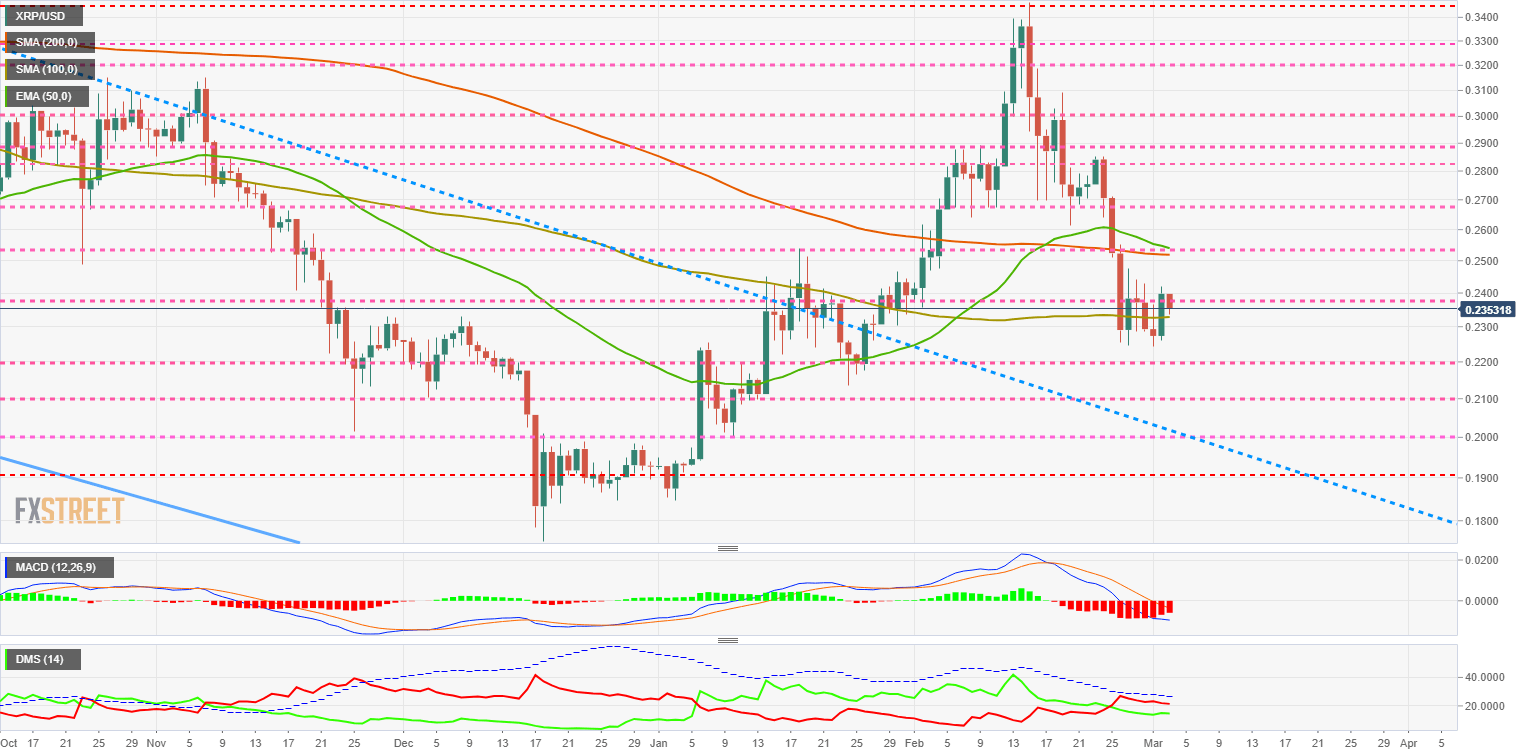 The MACD on the daily chart shows how the bearish trend is easing, although it is already within the bearish side of the indicator. An upward swing may find resistance at the 0 levels.
The DMI on the daily chart shows bears dominating the pair, but not far from the bulls.
Get 24/7 Crypto updates in our social media channels: Give us a follow at @FXSCrypto and our FXStreet Crypto Trading Telegram channel
