- Bitcoin hits a massive double-top pattern barrier at $19,500, opening Pandora’s Box for losses back to $17,600.
- Ethereum can barely hold above $580 while massive declines to $540 linger.
- Ripple loses ground above the 200 SMA as selling pressure intensifies, the bearish leg could revisit $0.4.
The price action in the cryptocurrency market has continued to be sluggish since the week started. Bitcoin has made several attempts to break out of the one-week horizontal resistance at $19,500 but in vain. On the other hand, stability in the market is assured by the buyer congestion at $19,000.
Intriguingly, some altcoins have spiked significantly over the last 24 hours. SushiSwap (SUSHI) and Synthetix (SNX) rose above the horizon, posting gains over 10%. The rest of the assets in the top 50 are dotting market red and green but without significant price action.
Bitcoin is on the brink of a massive correction
The horizontal resistance at $19,500 has led to a double-top pattern, which is a typically bearish indicator in technical analysis. A significant correction is usually anticipated after the formation of the chart pattern.
In this case, BTC has already retreated towards support at $19,000, but an intraday low has formed at $19,040. At the time of writing, Bitcoin is trading at $19,160 amid a building bearish picture. If the bearish leg stretches past $19,000, massive sell orders will be triggered, perhaps by the whales rushing to cash out profits as explained earlier.
Support is anticipated at the 100 Simple Moving Average on the 4-hour chart. However, if enough volume is created, BTC may be forced to seek anchorage at the 200 SMA or last week’s support at $17,600.
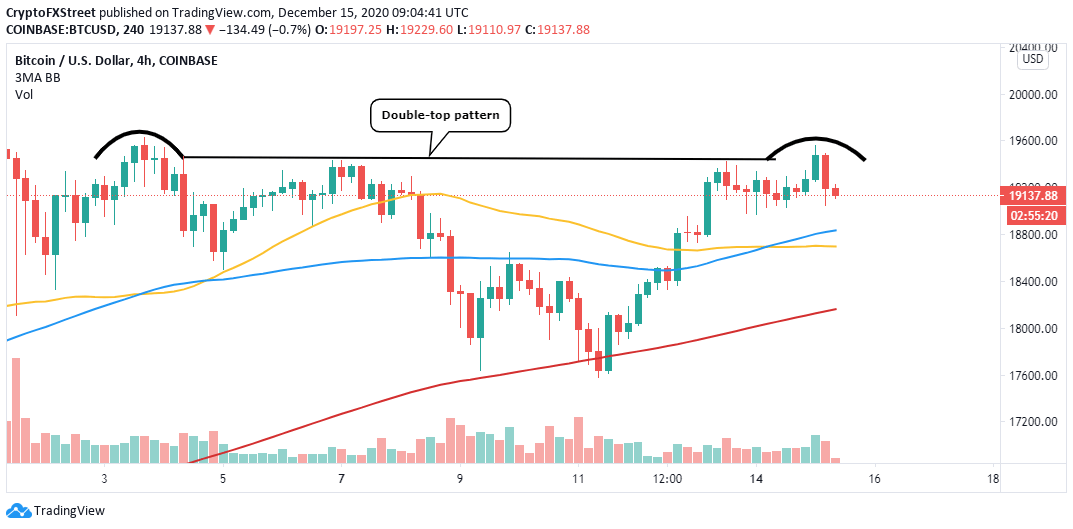
BTC/USD 4-hour chart
On the flip side, gains to $20,000 will come into the picture if BTC first holds above $19,000 and second, corrects beyond the double-top pattern at $19,500. The fear of missing out (FOMO) could drive Bitcoin significantly above $20,000.
Ethereum struggles to hold support at $580
Ether is holding steady above $580, but potential declines eye support at $540. A recent recovery was rejected under $600, hence the bearish grip. Meanwhile, the least resistance path is downwards.
The formation of an ascending wedge pattern could confirm the bearish outlook to $540. This bearish outlook forms when an asset’s price ascends with pivot highs and lows while converging at a single point.
A breakdown usually occurs before the trendlines converge. The typical breakdown is normally confirmed by decreasing volume. Price slumps are generally fast and drastic; therefore, traders have to work timely, precisely and accurately.
%20-%202020-12-15T121432.686-637436222863499254.png)
ETH/USD 4-hour chart
It is worth mentioning that the bearish outlook will be thrown out the window if Ether holds onto the 100 SMA and the support at $580. A reversal must also come into the picture, targeting $600. Trading above $600 may see Ethereum take on the resistance at $620.
Ripple dumps some more after losing key anchor
The cross-border token is on the cusp of a significant breakdown after sliding under the 200 SMA. The seller congestion at $0.45 might save bulls from a sharp fall to $0.4. However, the bearish scenario seems to have been confirmed by the Relative Strength Index’s slope toward the oversold region.
%20(30)-637436222927573241.png)
XRP/USD 4-hour chart
The TD Sequential indicator has presented a buy signal that may invalidate the pessimistic outlook. The bullish formation manifested in a red nine candlestick on the 12-hour chart. If authenticated, an upswing in one to four candlestick could place XRP in a trajectory eyeing $0.6.
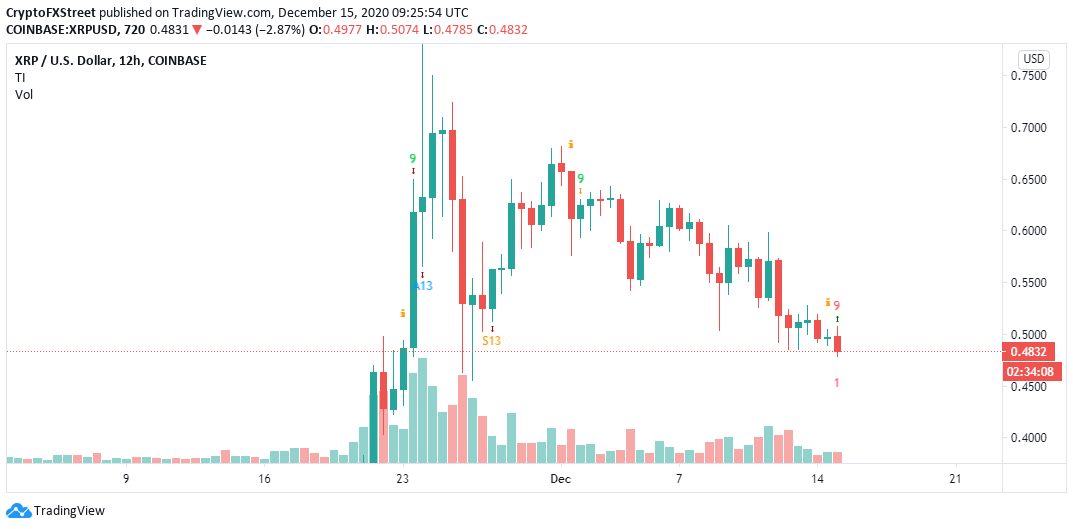
XRP/USD 12-hour chart
Similarly, the bearish narrative may be quashed if Ripple reclaims the lost ground above the 200 SMA and the seller congestion at $0.5. Trading above these levels will call for stability as buyers would prepare to pull the crypto past $0.6.
