- Bitcoin’s ongoing declines risk hitting $40,000, especially if support at $45,000 caves.
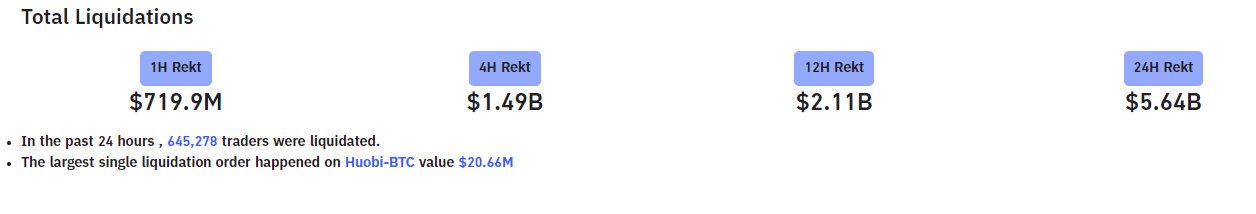
- Huobi-BTC recorded the biggest single liquidation of $20.66 million amid the cryptocurrency correction.
- Ethereum eyes $1,100 after crucial support levels have been shattered, including $1,600.
- Ripple is not oversold despite the massive breakdown, suggesting that losses may extend to $0.3.
Cryptocurrencies are gasping for air after corrections occurred across the board. The bloodshed has seen Bitcoin lose over 14% in 24 hours, testing support at $45,000. Ethereum did not escape the freefall, which has led to losses below $1,500.
Ripple’s cross-border token also suffered a massive blow, culminating in more than 23% declines toward $0.4. Most of the assets in the market are in red, posting double-digit losses.
Cryptocurrency derivatives post $6 billion in liquidations
Bitcoin started to retreat on Monday amid the news that Binance had suspended withdrawals. The largest-digital asset dropped from highs around $57,500 and failed to secure formidable support above $50,000. The selling pressure continued on Tuesday, leading to approximately $6 billion in liquidations across all exchanges.
According to the data released by bybt, roughly 645,000 traders have seen their positions liquidated in the last 24 hours. Note that the largest single liquidation order occurred on Huobi-BTC, totalling $20.66 million.
Crypto futures contracts liquidations
Bitcoin bulls hunt for support
Bitcoin is holding slightly above $45,000 at the time of writing. Higher support is needed to prevent another dip and also support the resumption of the uptrend. However, selling pressure is still rising under the 100 Simple Moving Average.
Consequently, the Moving Average Convergence Divergence (MACD) shows that recovery is a farfetched idea, at least for now. The technical indicator has sunk into the negative region. Besides, the MACD line (blue) keeps widening the gap below the signal line, thus validating the downtrend toward $40,000.
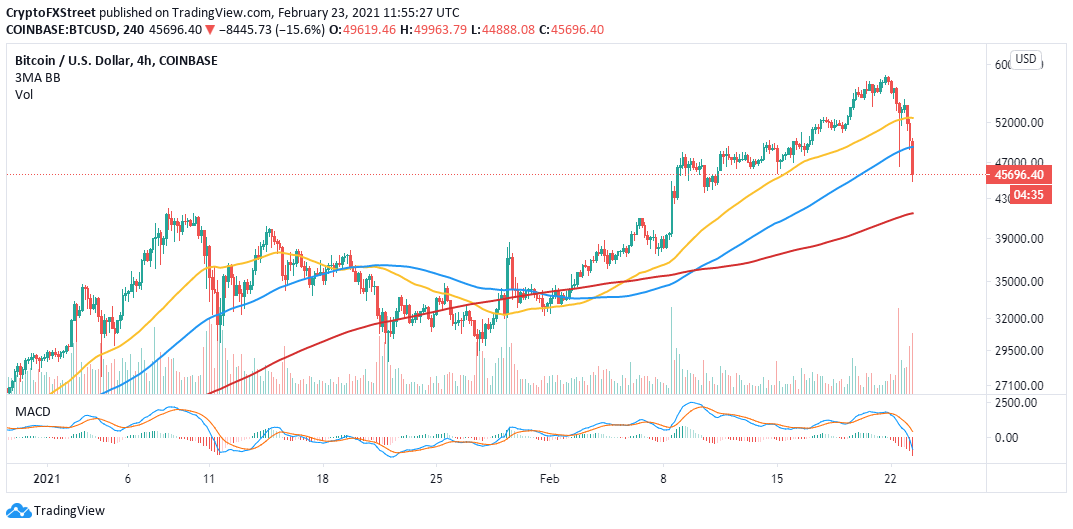
BTC/USD 4-hour chart
Support is need above $45,000 to focus the bulls’ attention on levels above $50,000. More buy orders will come into the market if BTC reclaims the ground past the 100 SMA. Keep in mind that traders may increase their positions because Bitcoin is relatively at a low price, which may raise the tailwind.
Ethereum breakdown eyes $1,100
Ether has recently achieved an all-time high of $2,041 on Coinbase. Although a price prediction placed the smart contract token above $3,000 in the near term, a correction occurred from Monday and it has been unstoppable.
At the time of writing, ETH is teetering at $1,470 after losing several tentative support areas such as the 50 SMA, 100 SMA and 200 SMA. The most significant blow appears to have been the slide under the 200 SMA, which saw the price tumble to $1,400.
If support at $1,400 fails to hold, we can expect the losses to hit levels around $1,100 before formidable support comes into the picture. The MACD continues to cement the bears’ position on the market, suggesting that the breakdown is far from over.
%20-%202021-02-23T142515.360-637496780995184095.png)
ETH/USD 4-hour chart
It is worth mentioning that a recovery will come into the picture if Ethereum holds the support at $1,400. On the upside, jumping above the 200 SMA will call for more buyers in the market as investor confidence in recovery builds.
Ripple makes an extensive about turn to $0.3
XRP had made a remarkable recovery after the massive breakdown from $0.75 in early February. However, a resistance wall at $0.65 cut short the gains around mid-month, leading to declines that tested $0.5. Another spike occurred on Monday this week, but the same hurdle at $0.65 was a hard nut to crack.
The resistance brought to light a double-top pattern that may not have been confirmed were it not for the widespread declines in the market. At the time of writing, XRP has plunged to $0.5, as the 200 SMA failed to cushion the token from the freefall.
The path with the least resistance is downwards, as highlighted by the Relative Strength Index (RSI). Since the RSI is not oversold yet, XRP could fall further toward $0.3.
%20(100)-637496780952804071.png)
XRP/USD 4-hour chart
To abandon the potential losses to $0.3, XRP must hold above $0.35 if not $0.4. On the upside, a jump past the 200 SMA will trigger more buy orders as investors anticipate recovery toward $0.65.
