- Bitcoin price reveals a loss of bullish momentum before testing a critical resistance level at $42,000.
- Ethereum price fails to surpass the 50-day SMA at $2,839 for the second time, leading to a correction.
- Ripple price also faces a premature sell-off and is likely to retest the support barrier at $0.84.
Bitcoin price is facing a hard time climbing up after two deadly crashes on May 19 and May 23. Ethereum and Ripple are in the same boat as BTC, but most altcoins have already recovered.
China tightens the noose around mining
China appears to be taking Bitcoin and crypto mining seriously as it imposed palpable rules that will deter Chinese enthusiasts from mining.
The recent reports issued by BitDeer, a cloud mining company, added that it would block all IPs related to mainland China to comply with regulatory requirements. Other mining companies that are taking similar actions include Huobi, ByBit and BitFuFu.
Iran, another popular hub for mining cryptocurrencies, has implemented an outright ban to make matters worse. The ban, which is effective today, will last until September 22, per President Hassan Rouhani’s comments on state TV.
The recent stance of China and Iran on Bitcoin mining seems to have taken a heavy toll on BTC price, which has sent it tumbling.
Bitcoin price faces an uphill battle
Bitcoin price has recovered roughly 30% from its crash on May 19. This move up has resulted in a test of the resistance level at $40,586. It appears that investors began to book profits, pushing the pioneer cryptocurrency lower to where it currently trades at $37,486.
The supply zone extending from $43,000 to $46,638, harboring the weekly open at $46,426, is extremely important. There’s a high chance Bitcoin price will not slice through this in the coming week. Any upticks above it will likely be short-lived.
Therefore, investors need to keep a close eye on this zone.
Moreover, this rejection will mainly be caused by market participants caught off guard during the May 19 crash who are trying to break even. Therefore, BTC price may reverse at these levels and head lower.
Assuming Bitcoin tags the weekly open and heads lower, the wall at $40,586 will be its first support level. A breakdown of this area will lead to a retest of $34,049.
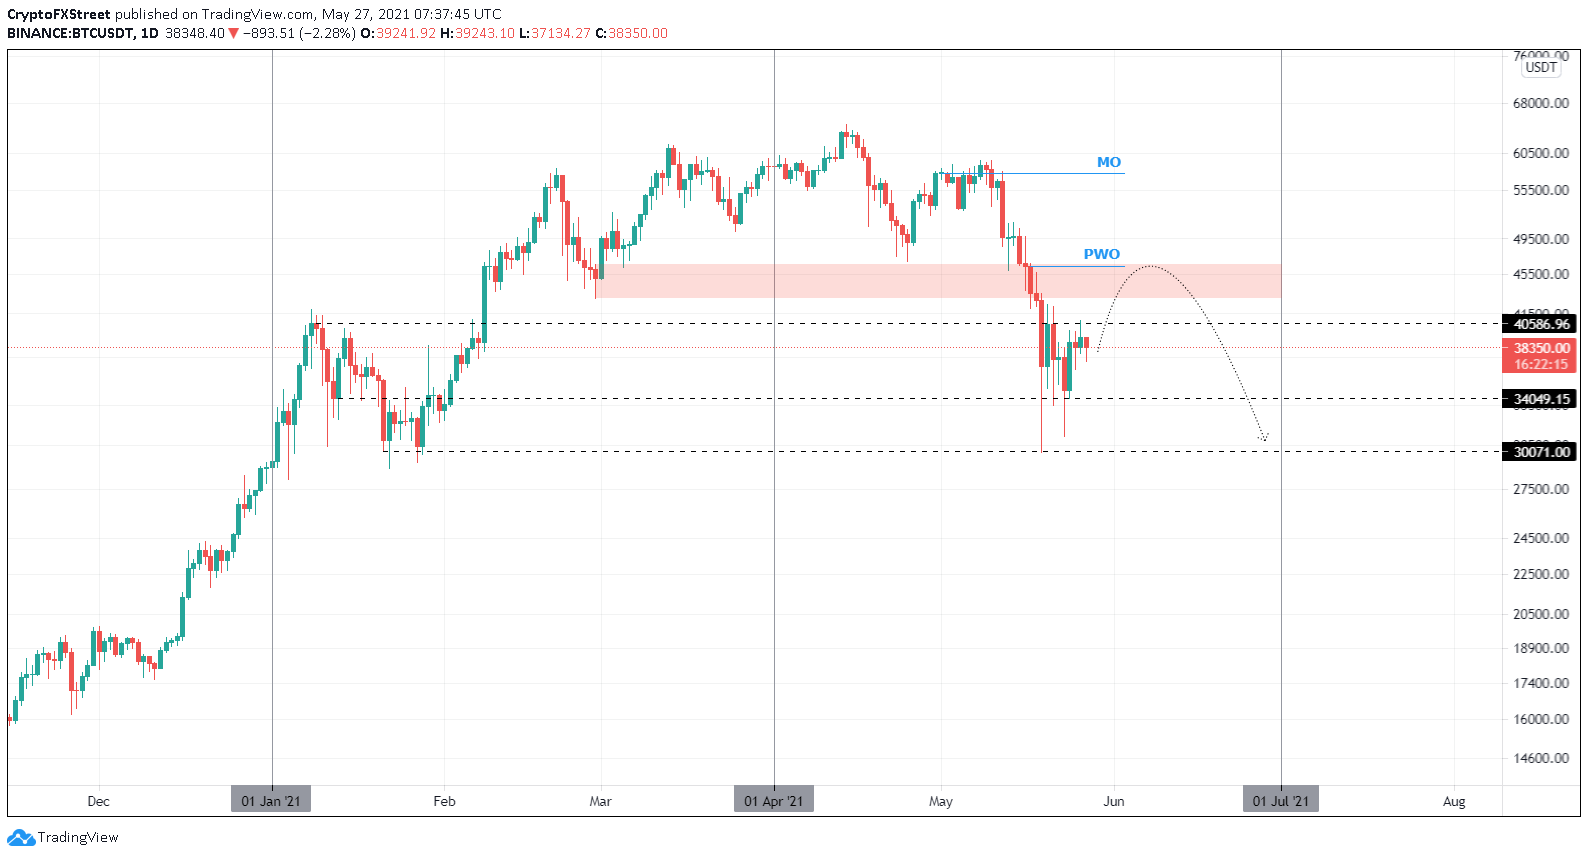
BTC/USD 1-day chart
While the scenario explained above is leaning bearish, a decisive close above $50,000 will invalidate it. If such a narrative were to evolve, investors could expect Bitcoin price to rally 25% to tag the monthly open at $57,697.
Ethereum price pays for bulls’ inability
Ethereum price is facing its second rejection at the hands of the 50-day SMA at $2,839. If a similar turn of events were to unfold, ETH could be headed toward the demand zone that extends from $2,153 to $1,730.
While this would be an extremely bearish case, the 100-day SMA at $2,304 will be the first pitstop for sellers or an entry point for buyers.
Failing to hold above this barrier would drag the altcoin pioneer down to the weekly open at $2,101.
Optimistically, ETH is looking at a 15% drop to $2,304, but under dire circumstances, this crash could extend up to 24% to $2,101. ETH will likely begin its reversal after retesting this level or briefly dipping below it.
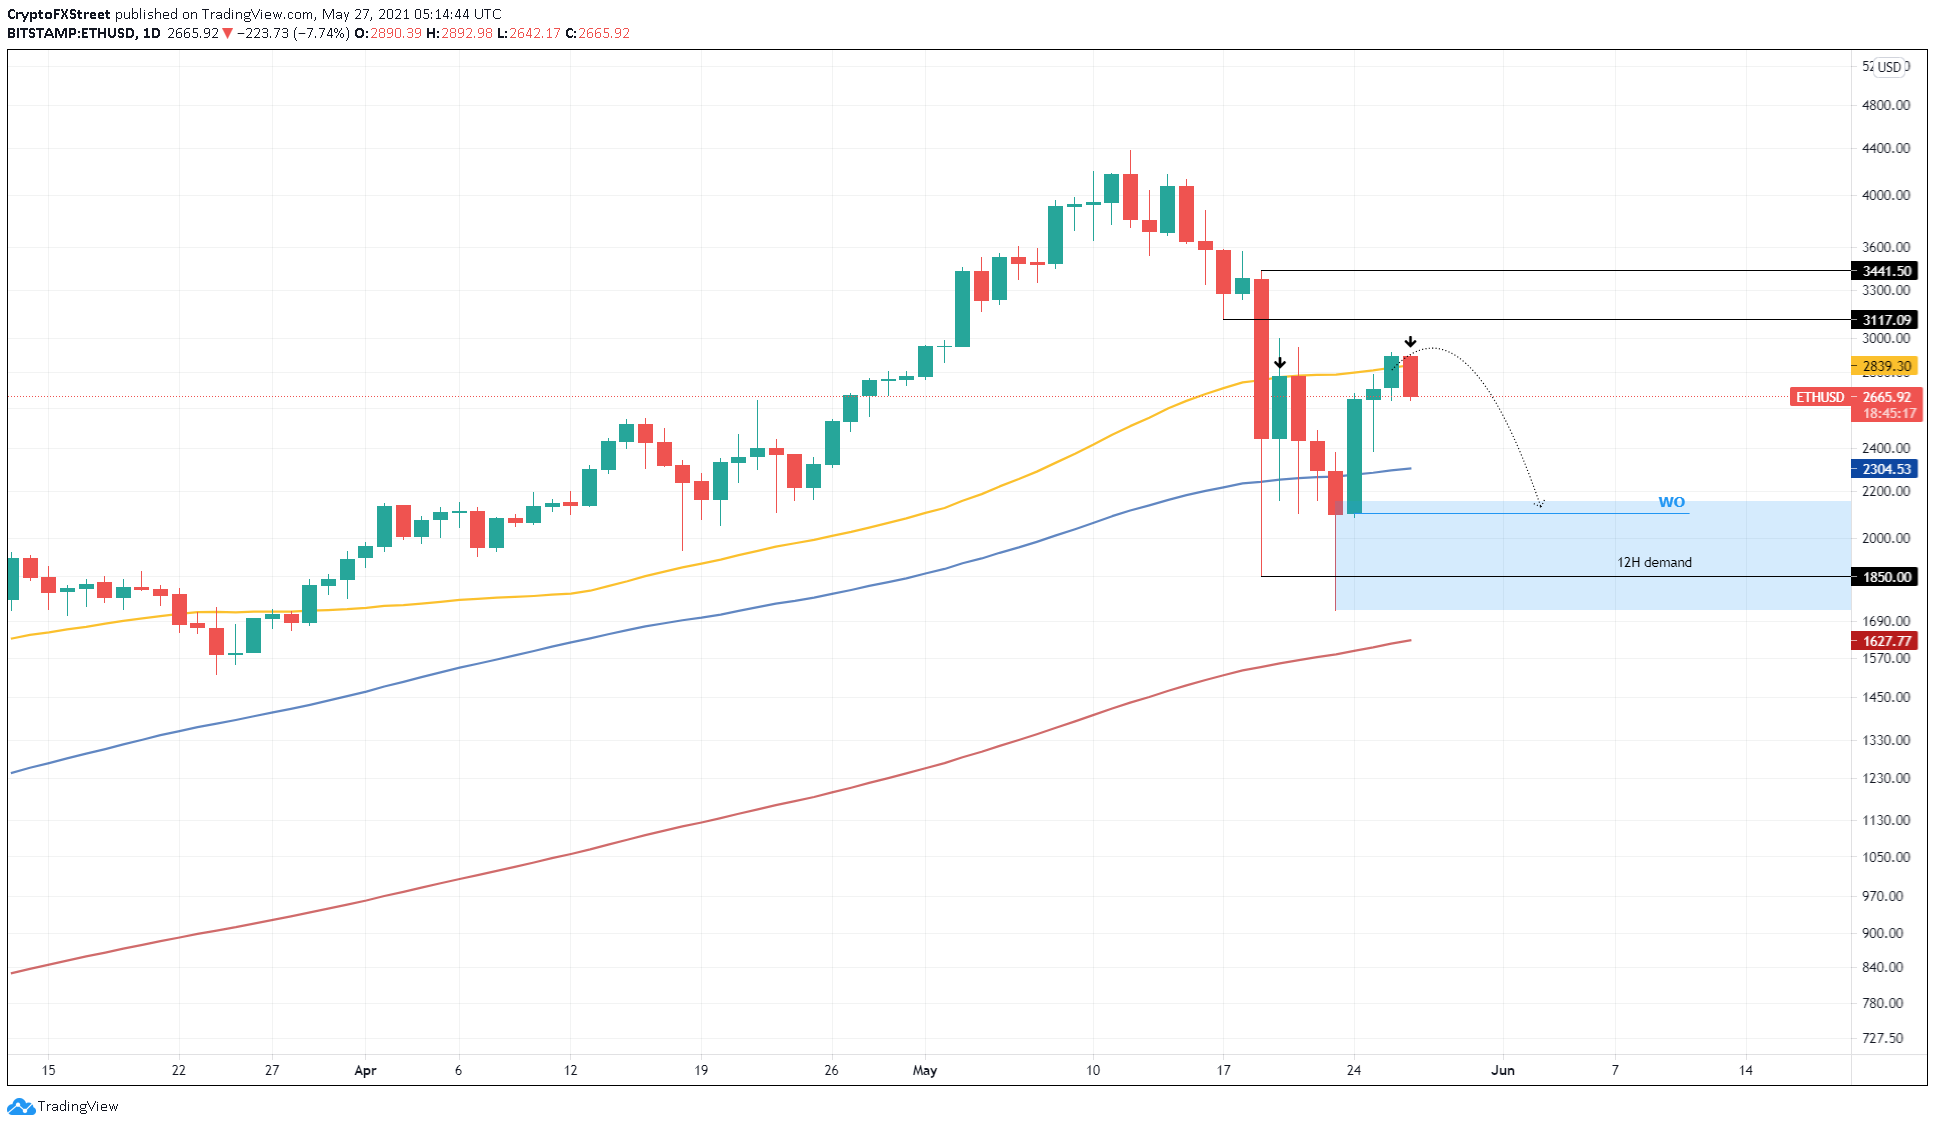
ETH/USD 1-day chart
On the flip side, if Ethereum price continues to surge above the 50-day SMA at $2,839 and produces a decisive daily close above $3,117, it would invalidate the bearish thesis. In this newly developed narrative, ETH could rally 10% to test the swing high at $3,441 set up on May 19.
Ripple price stuck in an arduous journey
Ripple price is heading higher as it sets up multiple higher highs. However, the recent swing highs have been higher lows, suggesting a waning buying power. Due to this shift in trend and multiple overhead barriers, including the supply zone extending from $1.094 to $1.183, XRP price is coiling up and is likely to head lower.
The support barrier at $0.84 appears to be the best place for a reversal since it coincides with an inclined support trend line. Therefore, investors can expect XRP price to slide 16% to $0.84 before kick-starting an ascent.
If the selling pressure persists here, the remittance token could retest the demand zone’s upper limit at $0.642.
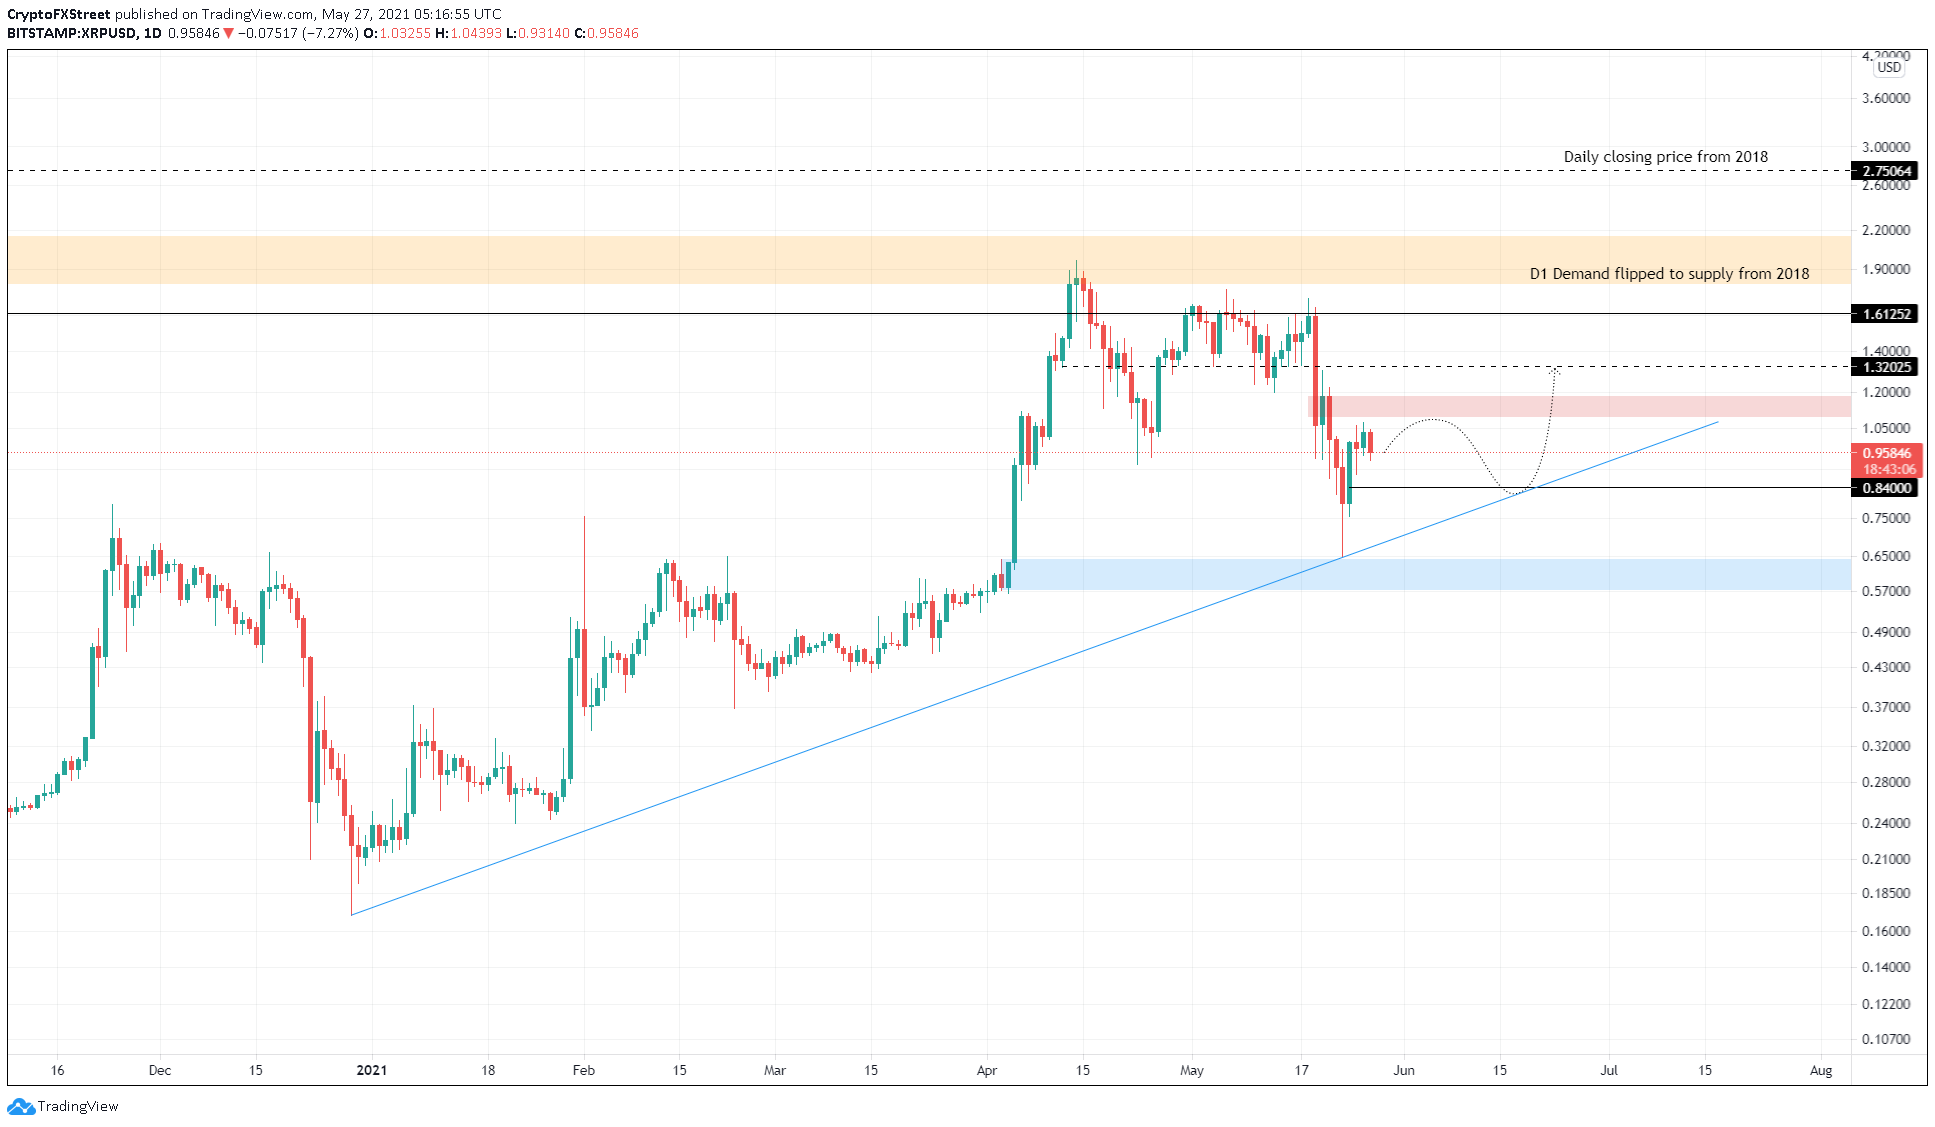
XRP/USDT 1-day chart
If a decisive daily candlestick close above $1.183 arrives before the pullback detailed below, it will invalidate the bearish narrative. In such a case, the bulls might propel XRP price up by 12% to $1.320.
