- Ethereum surprises on the rise and takes its valuation in Bitcoin to January 2019 levels.
- King Bitcoin has options for revenge in the short term.
- Market sentiment chart draws a pattern with negative short-term outlook.
Ethereum exploded in the final hours of the American session yesterday, dealing a significant blow in its particular battle against Bitcoin.
Technical analysis in previous days had shown the possibility of a bullish extension move, and Ethereum was the first to take that opportunity to break the $400 barrier definitively.
The sharp rise in Ethereum has extended to the rest of the Altcoin segment, and the crypto board is green today with very significant rises, while Bitcoin is delayed and waiting for its opportunity.
Bitcoin now has its chance to respond to Ethereum’s attack. The technical indicators in Bitcoin are a few hours behind ETH, and the King could copy Ethereum’s move.
The window of opportunity for Bitcoin is narrow. If Ethereum continues to rise against Bitcoin in the next few hours, the Altcoin segment will again lead the market, and the King will be left behind again.

The historical sentiment chart on the alternative.me site, shows congestion in the 75-80 range, a pattern that led to a sudden drop in the past. The chart covers from the beginning of 2018, i.e. the whole winter crypto so that it could be different this time, we will see.
ETH/BTC Daily Chart
The ETH/BTC pair is currently trading at the 0.036 price level and is trying to stay above the price congestion support in today’s session. If the upward movement continues, the previous bearish momentum will fade, and Bitcoin could make up for lost ground against Ethereum.
Above the current price, the first resistance level is at 0.038, then the second at 0.0387 and the third one at 0.0425.
Below the current price, the first support level is at 0.036, then the second at 0.035 and the third one at 0.0332.

The MACD on the daily chart undoes the bearish cross, but it must confirm the change in direction in today’s session, or it will move downwards.
The DMI on the daily chart reflects yesterday’s rally, but it is noticeable that the bears have only slightly decreased their strength, which increases the chances of a return to the bearish setup.
BTC/USD Daily Chart
The BTC/USD pair is currently trading at the price level of $11697 and seems unable to break out of the price congestion resistance level at $12000.
Above the current price, the first resistance level is at $12000, then the second at $14000 and the third one at $17150.
Below the current price, the first support level is at $11130, then the second at $10650 and the third one at $9650.
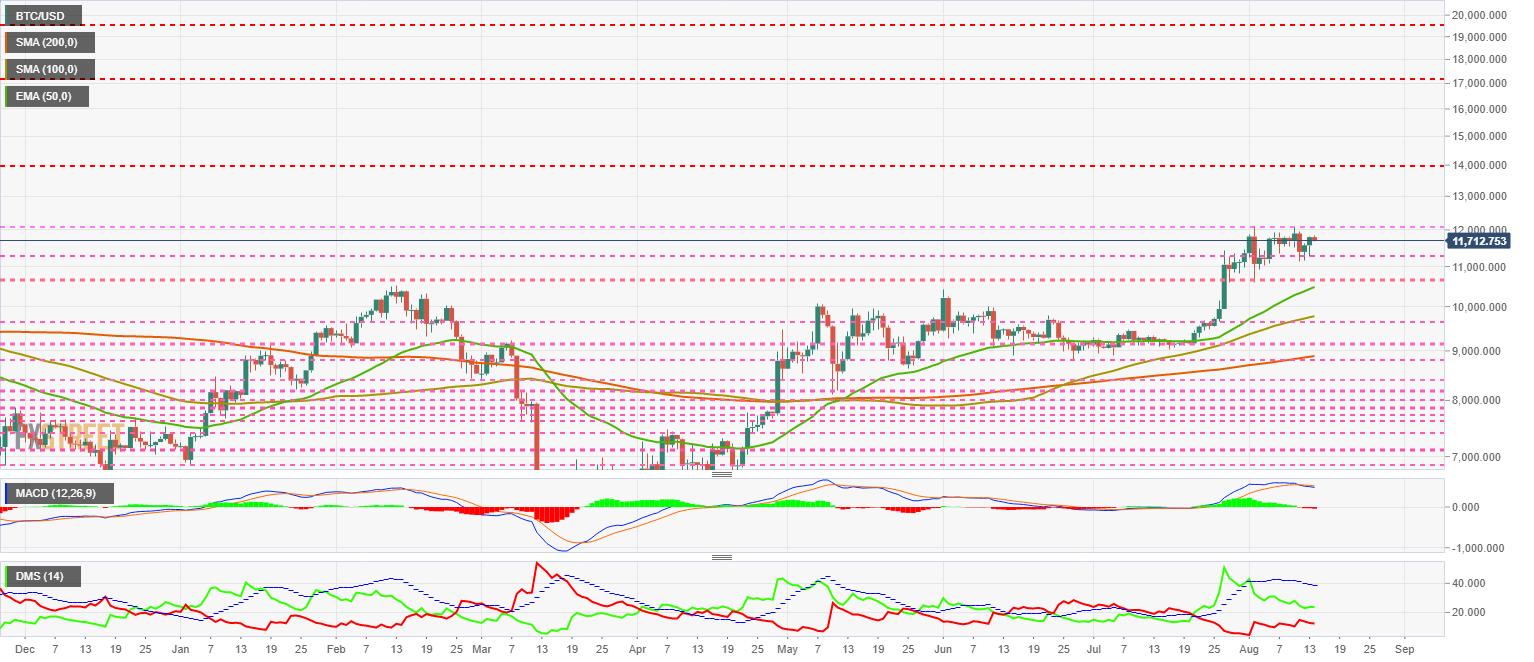
The MACD on the daily chart is losing its downward slope, but is still in a downward cross. The BTC/USD pair still has options to move higher as Ethereum has done, but this possibility is decreasing over time.
The DMI on the daily chart shows both sides of the market unchanged from previous days. The bulls have not made the typical bearish crossover move to the ADX line, so a bullish move from Bitcoin is very likely.
ETH/USD Daily Chart
The ETH/USD pair is currently trading at the $423 price level after having peaked at $430 following yesterday’s bullish attack.
Above the current price, the first resistance level is at $430, then the second at $485 and the third one at $520.
Below the current price, the first support level is at $385, then the second at $355 and the third one at $315.
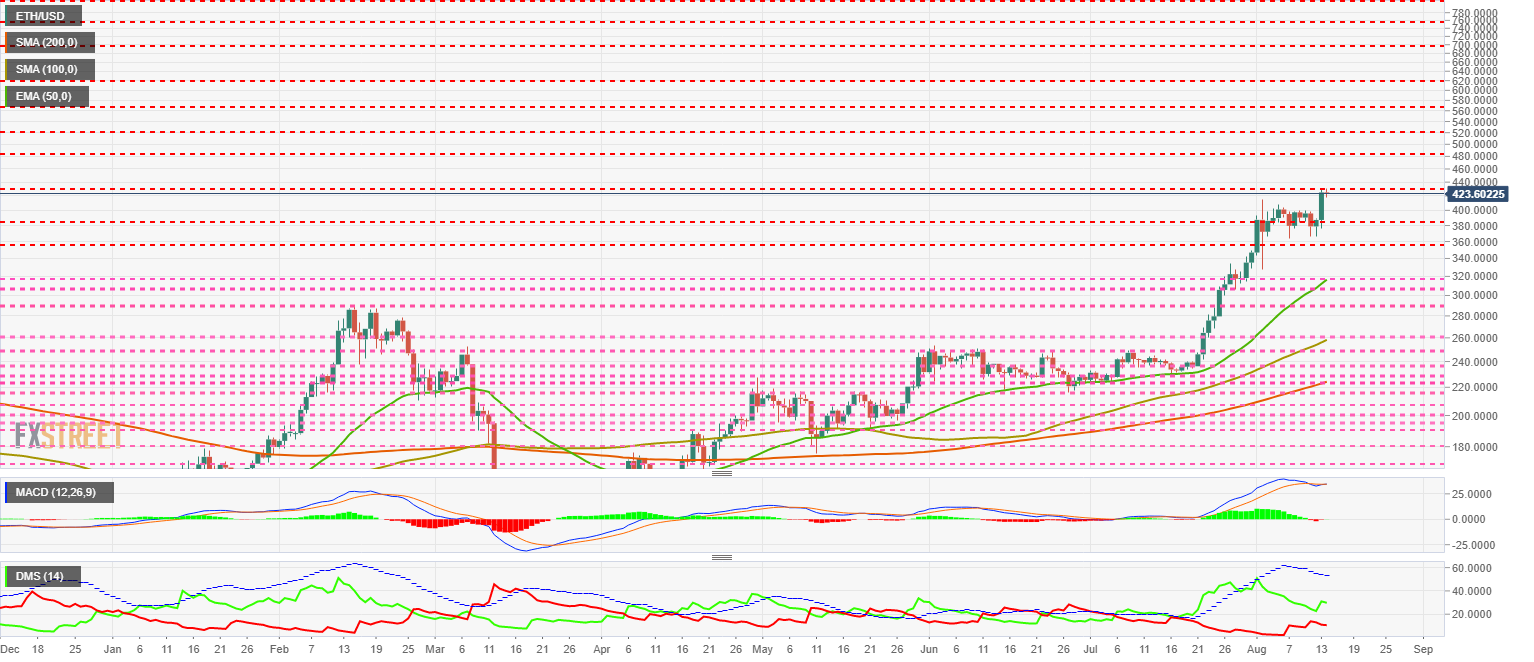
The MACD on the daily chart is attempting to undo the previous bearish cross.
The DMI on the daily chart shows the rebound from yesterday’s rally, highlighting that bears do not respond to price increases by decreasing their trend strength.
XRP/USD Daily Chart
The XRP/USD pair is currently trading at $0.2937 and appears to be pausing the upward movement that began yesterday.
Above the current price, the first resistance level is at $0.30, then the second at $0.32 and the third one at $0.33.
Below the current price, the first support level is at $0.289, then the second at $0.28 and the third one at $0.27.
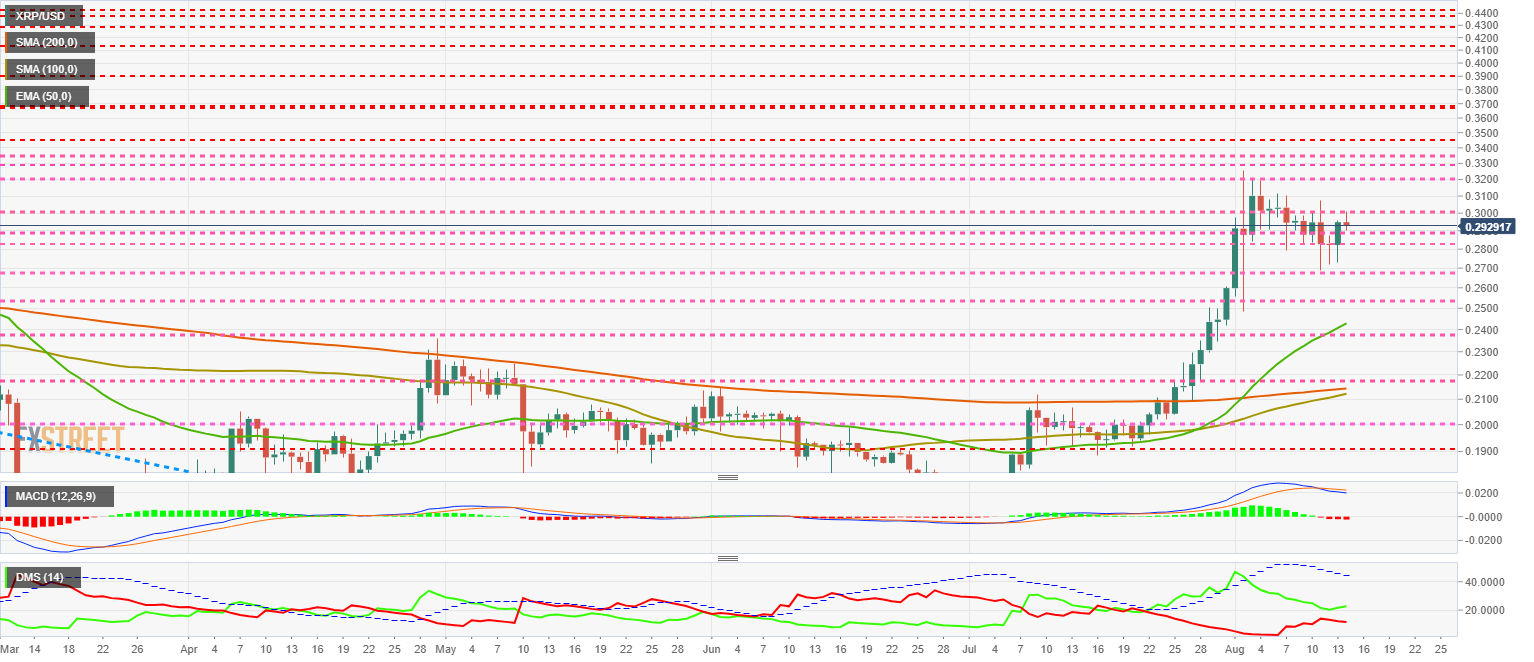
The MACD on the daily chart continues to cross downward, although the moving averages are flattening and could follow Ethereum’s example and move higher.
The DMI on the daily chart shows a bullish spike while the bears are losing some strength.
