- Bitcoin has conceded market share to the altcoin segment, which has reacted with strong gains.
- The ETH/BTC pair has taken a pause after Ethereum gained 52% in two days against Bitcoin.
- XRP keeps playing at the edge of the abyss, subject to any regulatory action.
2021 has started impressively in the altcoin segment of the crypto market, seizing the first concession in many weeks that King Bitcoin has allowed. Altcoins have taken it and have grown the rest-of-the-market segment.
The Bitcoin dominance chart is showing a significant decline from the 73.64 level (relative peak.) Bitcoin dominance is now at around 69.32.
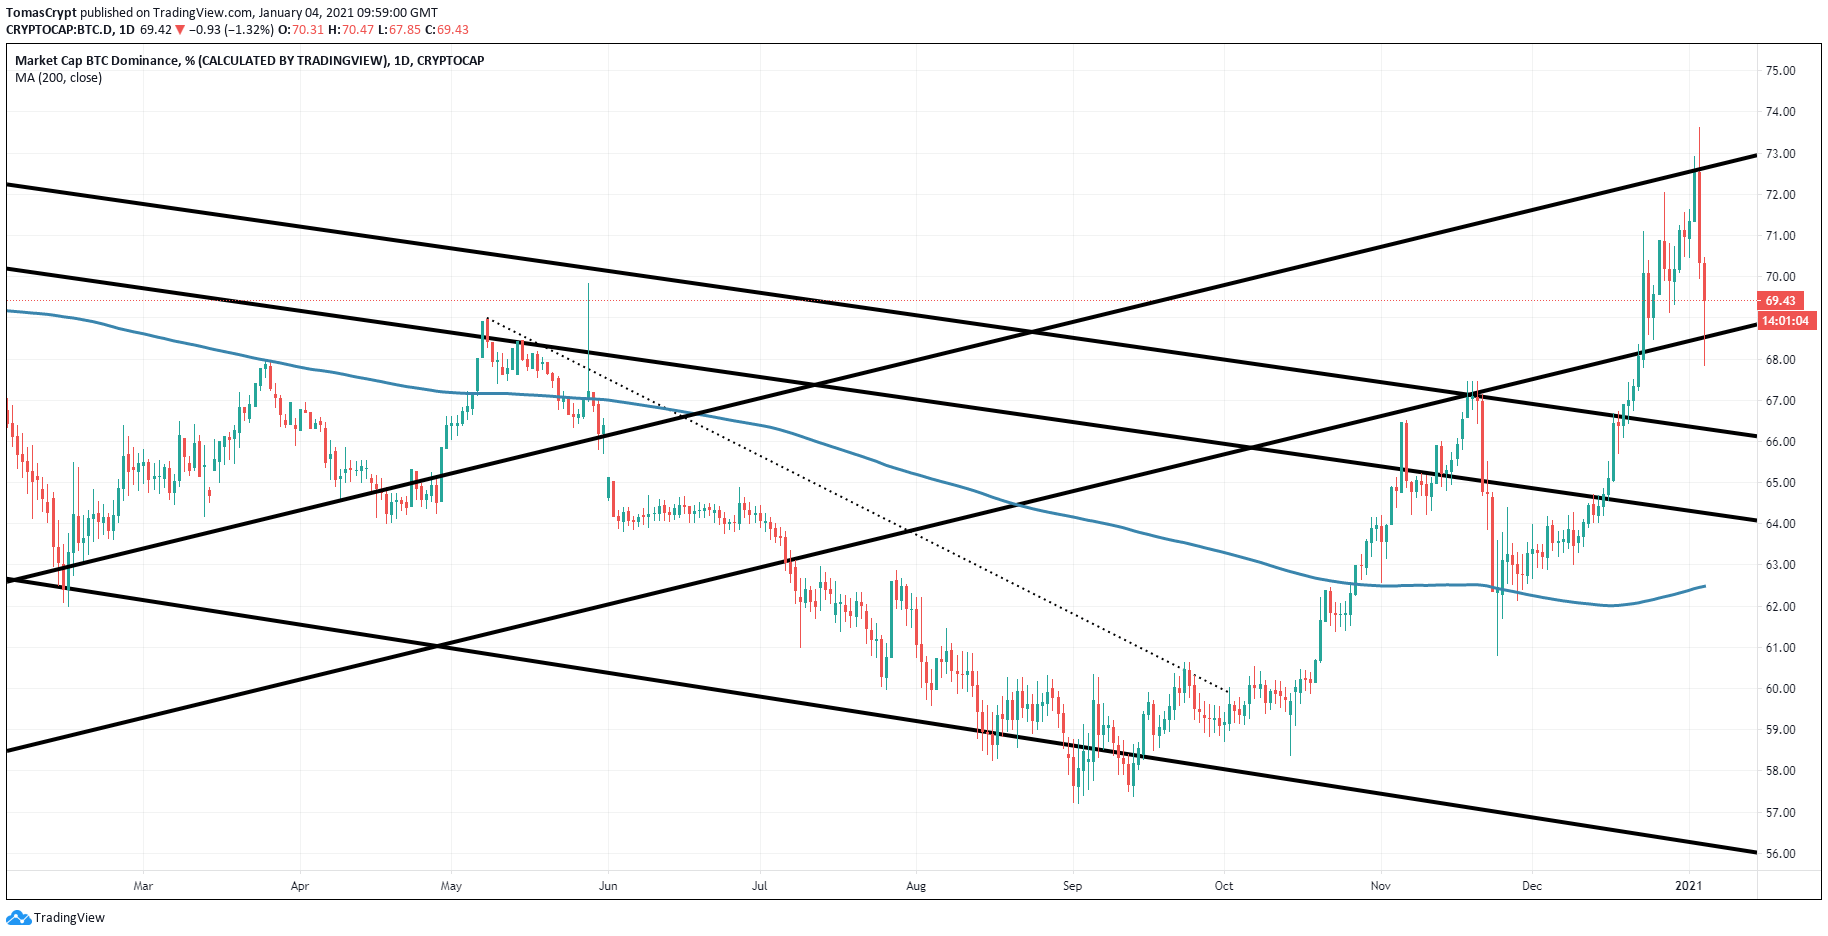
The opportunity window offered to Altcoins may be limited in time, as the dominance chart is moving within a bullish channel whose base coincides with the current price level.
The loss of the current level would take Bitcoin’s dominance level into the 66% market share range. Even more importantly, it would place it within a more positive expansionary side structure for the rest of the Crypto market members.
ETH/BTC Daily Chart
The substantial rise in the price of the Ethereum in the last two sessions leaves significant changes in the ETH/BTC pair. After a significant downward trend in late summer, the Ethereum/Bitcoin ratio increased by 52.56% in two sessions and is now back at 0.030.
If the situation continues throughout Monday’s session, it will confirm the end of the previously mentioned downward trend, confirming the beginning of a new altcoin season.
The 200-day simple moving average is accompanying the upward movement, breaking the trend line and increasing the chances for a trend continuation.
The ETH/BTC pair is currently trading at the price level of 0.03145.
Above the current price, the first resistance level is at 0.03163, then the second at 0.0332 and the third at 0.03505.
Below the current price, the first support level is at 0.03017, then the second at 0.02915 and the third at 0.0275.
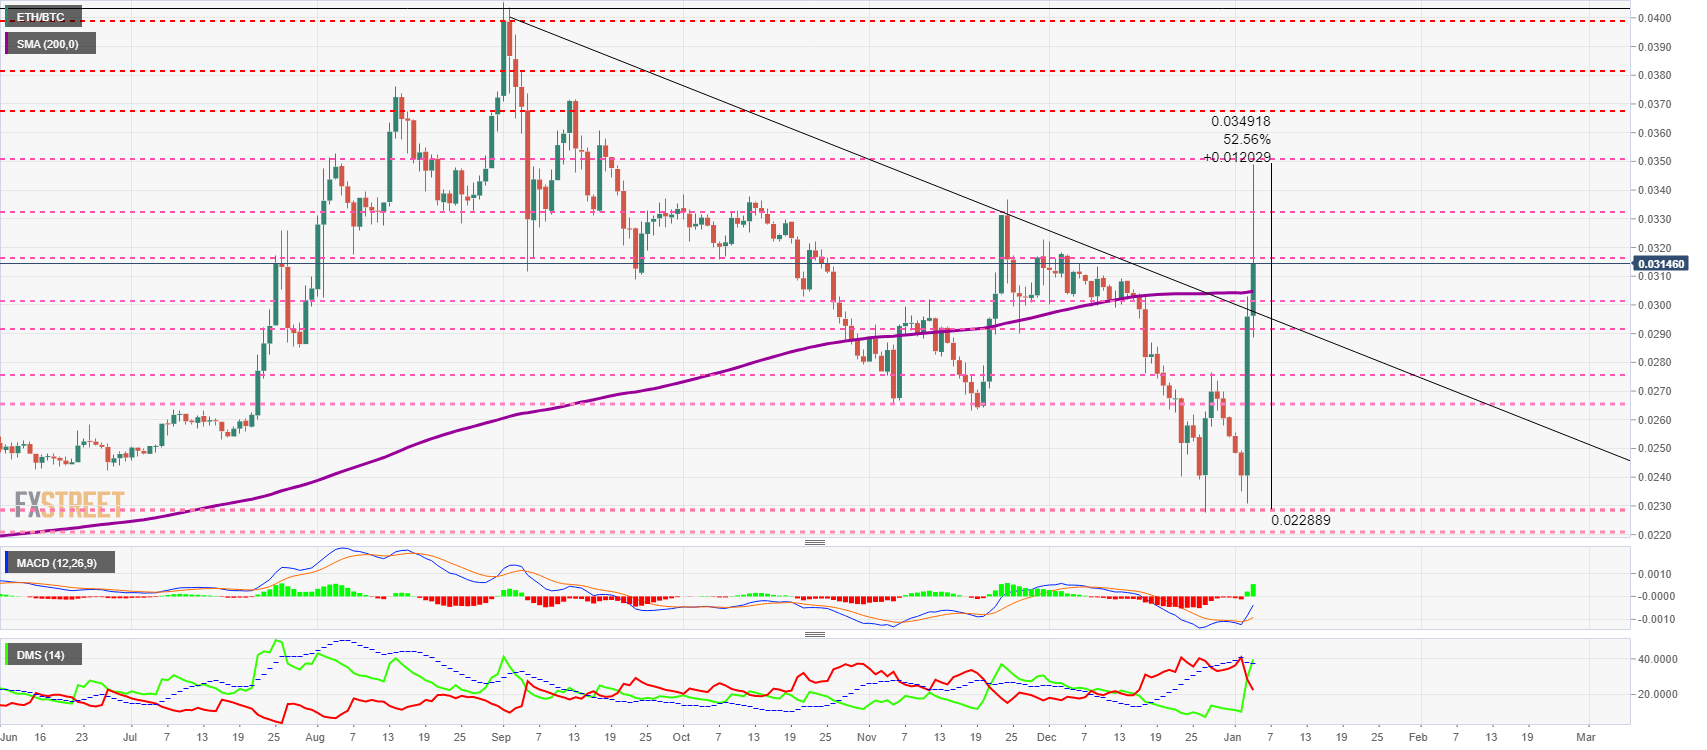 The MACD on the daily chart has turned sharply upward and is rapidly moving towards the neutral level of the indicator where upward resistance may appear.
The DMI on the daily chart quickly has placed the bulls above the bears and triggered a bullish pattern by moving above the ADX line. This indicator of trend strength is reasonably high, suggesting significant volatility for the next few sessions.
BTC/USD Daily Chart
The BTC/USD pair is currently trading at $30,931 and is temporarily moving away from the all-time high of $34,800. The strong upward momentum maintained by Bitcoin over the past few weeks has left much room for support below the current price.
Above the current price, the only resistance level is at the all-time high price level. Above that level, the BTC/USD would again enter a free ride.
Below the current price, the first support level is $28,900, then the second at $26,400 and the third one is at $24,000.
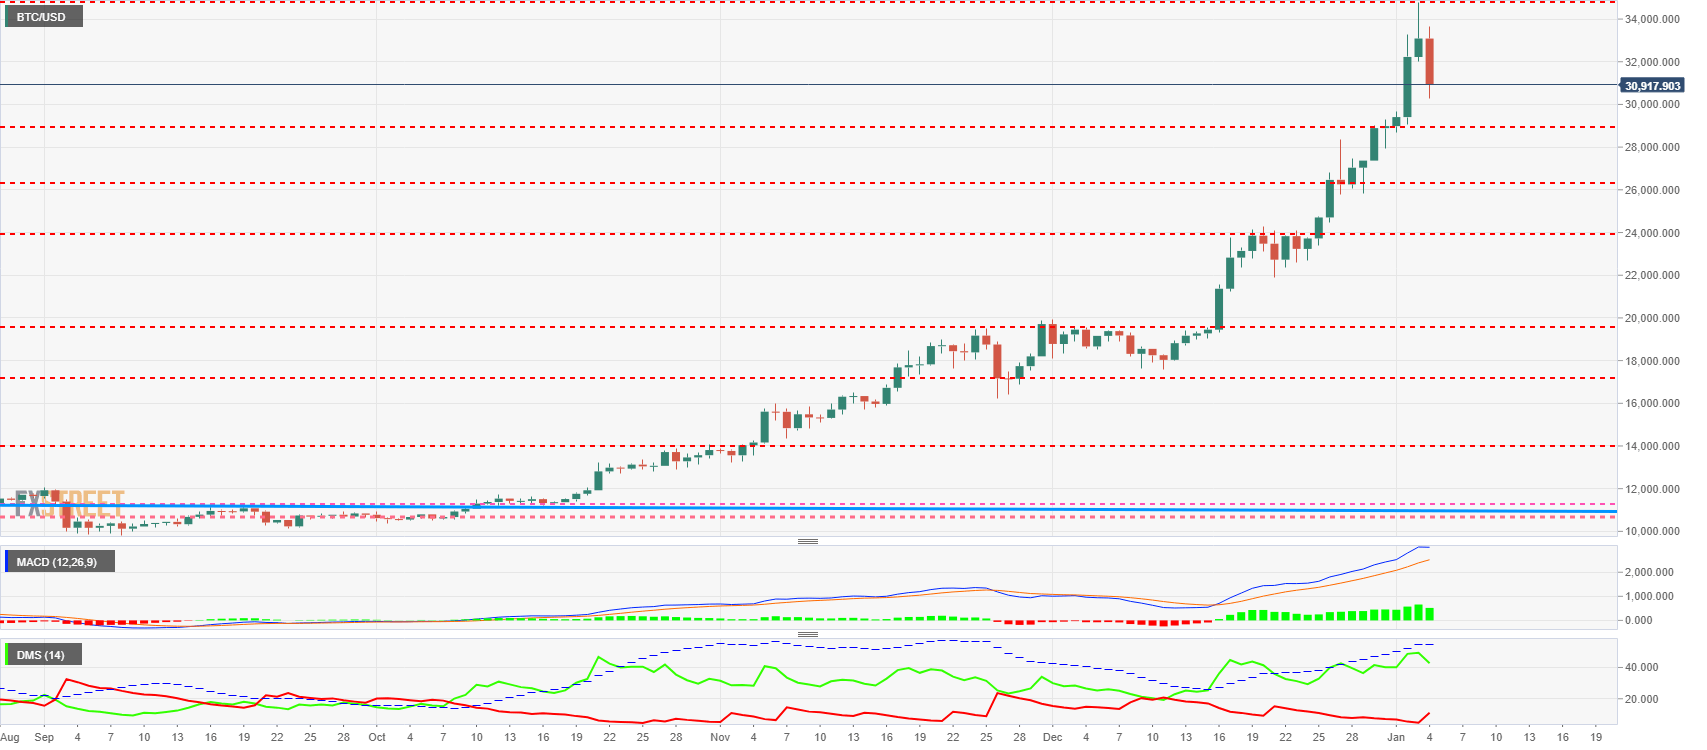 The MACD on the daily chart shows signs of weakness as it has reached the maximum gap between the moving averages of the entire upward movement, which could confirm a pause in the upward trend of the BTC/USD.
The DMI on the daily chart shows the bulls are losing strength but not losing the uptrend. The bears are bouncing up from near-zero levels, far from questioning the buying side’s absolute control.
ETH/USD Daily Chart
The ETH/USD pair is currently trading at $958.34 after reaching $1,166 at the Asian session.
The current price level coincides with an upward trend line that ETH/USD broke in the summer of 2018, which could complicate the price upward development. The price level to watch today is $1,067. If ETH/USD closes above this price level, the upward movement will be clear to the next level.
Above the current price, the first resistance level is at $1,067, then the second at $1,155 and the third is $1,290.
Below the current price, the first support level is at $875, then the second at $812 and the third one at $755.
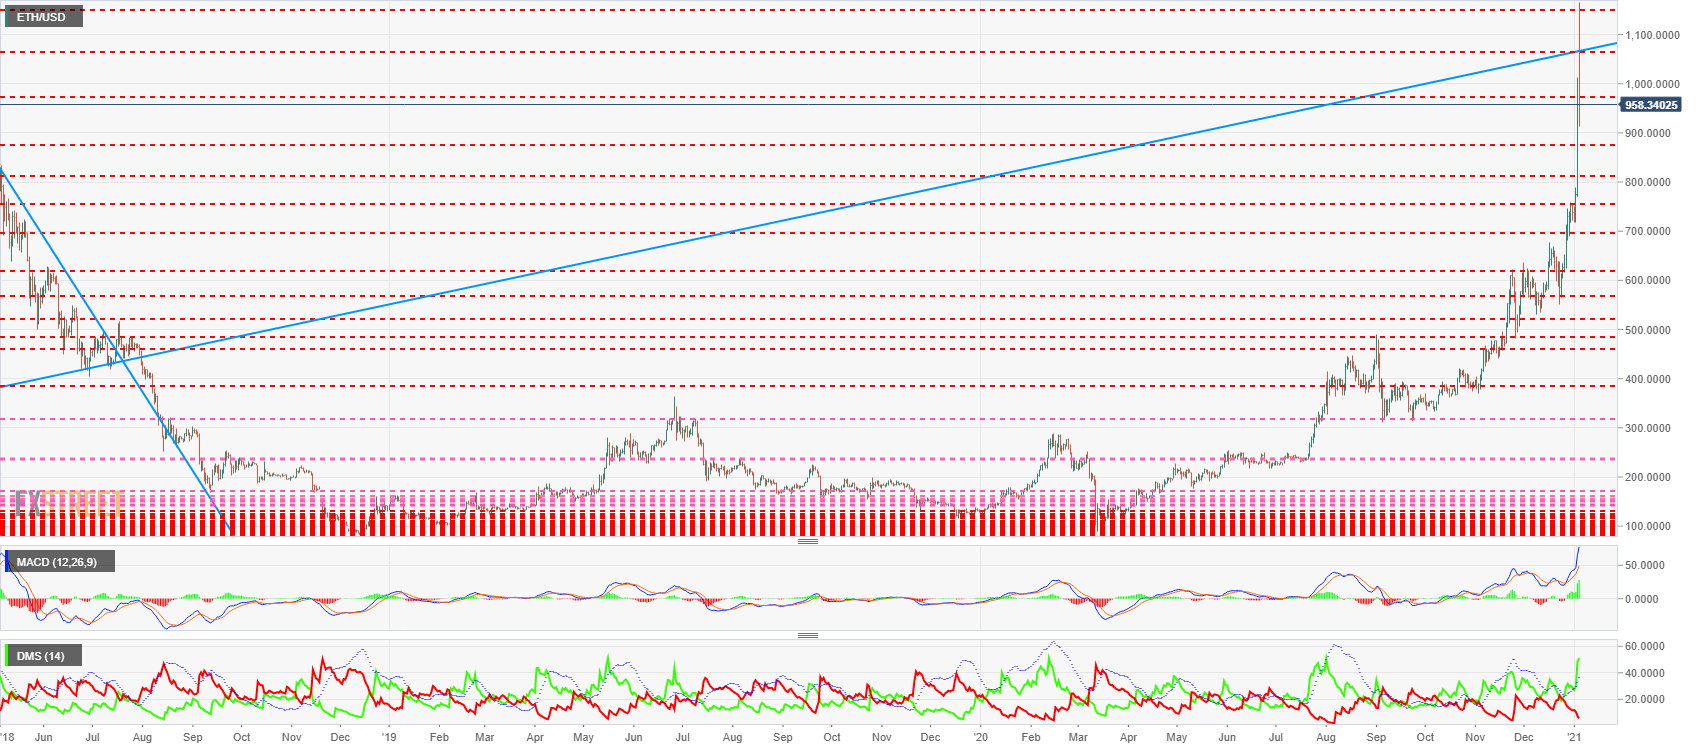 The MACD on the daily chart shows an extreme bullish profile, resulting from the last few hours’ upward movements. The current level makes a correction in the short term very possible, allowing a return to more suitable tilt levels for the midterm.
The DMI on the daily chart shows the bulls at their highest levels since last August. Current levels of strength on the buying side do not usually remain for long, so we may see an easing on the long side. Bears are quickly moving down but have room on the downside, supporting the ETH/USD price continued upward movement.
XRP/USD Daily Chart
The XRP/USD pair is currently trading at the price level of $0.2255 and is following the altcoin segment movement without much conviction.
The collapse after the SEC filing took the XRP/USD to $0.175 but XRP managed to close above the upward trend line from the March 2020 lows.
Above the current price, the first resistance level is at $0.2371, then the second at $0.2612 and the third one at $0.305.
Below the current price, the first support level is at $0.2123, then the second at $0.1935 and the third one at $0.1764.
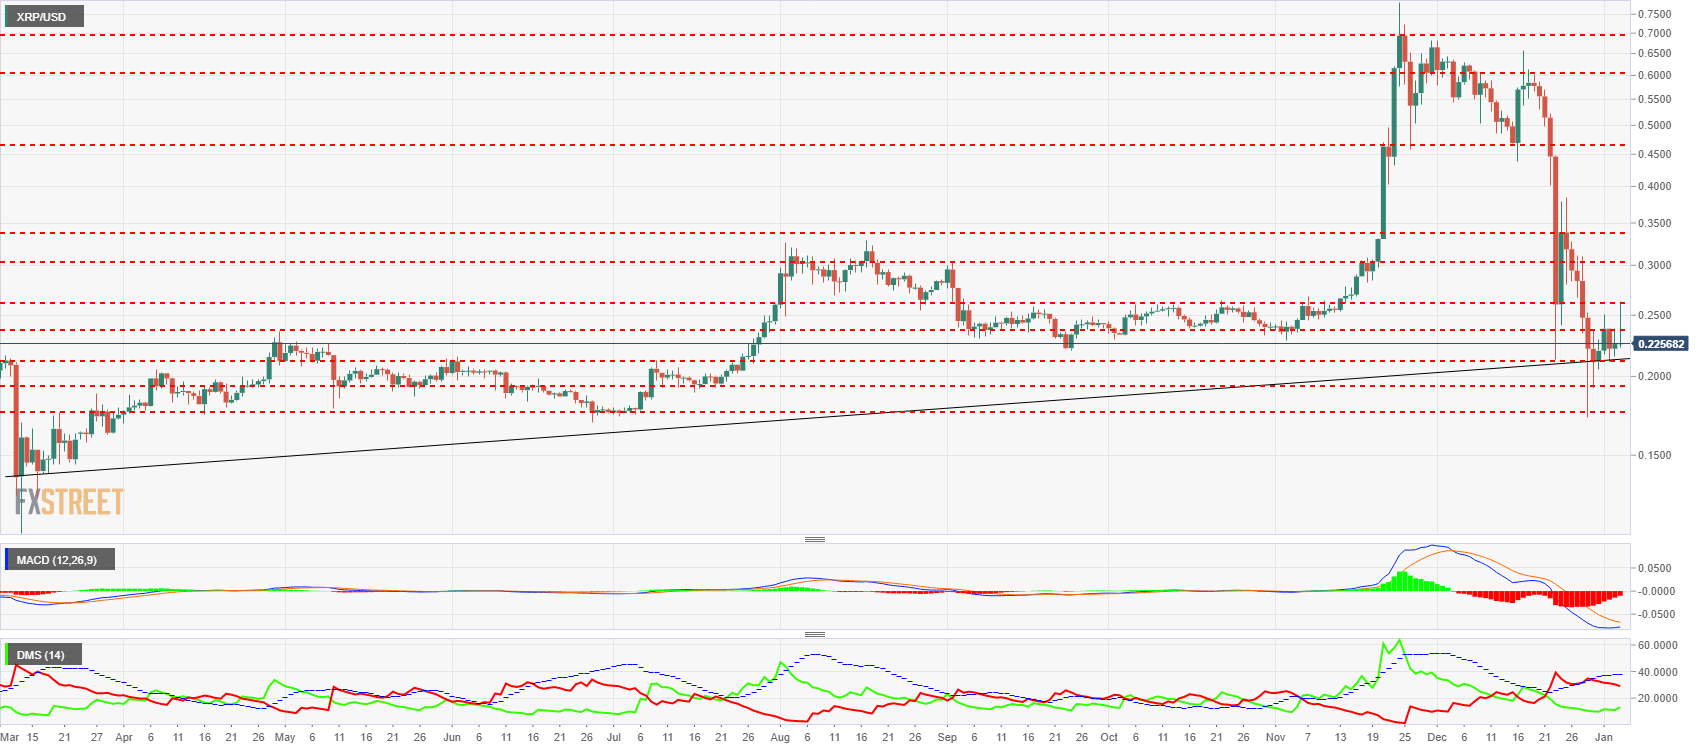 The MACD on the daily chart shows a favourable positioning for a bullish cross in the short term. The current situation of the XRP, totally dependent on the actions that the SEC may decide, puts any possible scenario under quarantine.
The DMI on the daily chart shows the bears losing some strength, but they are still at very high levels that assure them control over the price action. The bulls are increasing their power a little but even have room to move downwards.
