- Bitcoin price stalls at the strategically important 200-day simple moving average (SMA).
- Ethereum price surge from $2,000 stalls at the tactically important 50-day SMA.
- XRP price recaptures 2021 rising trend line and overcomes important price range.
Bitcoin price confronts a range of formidable resistance that may prevent it from gaining any price traction in the days ahead, creating a headwind for the broader cryptocurrency complex. Ethereum price has molded a potential double bottom pattern on the charts, providing investors a tactical opportunity to initiate a new position. XRP price bounces from a key range and, although associated with legal uncertainty, has improved the outlook for Ripple to secure a robust bottom above relevant resistance levels.
Stablecoin supply surpasses $100 billion
The total supply of dollar-pegged stablecoins has exceeded the $100 billion level. The two most significant stablecoins guide most of the growth: Tether’s USDT and the Centre consortium’s USD Coin (USDC).
Tether (USDT) is responsible for over 60% of the market share at the current value, while USDC has over a 20% share. USDC’s market share has been increasing faster in the last few weeks, thanks to major partnerships with companies like Visa.
The notable jump in stablecoins from $30 billion at the beginning of 2021 to the current value of $100 billion indicates that market operators are increasingly utilizing funds in the areas of derivatives and decentralized finance (DeFi).
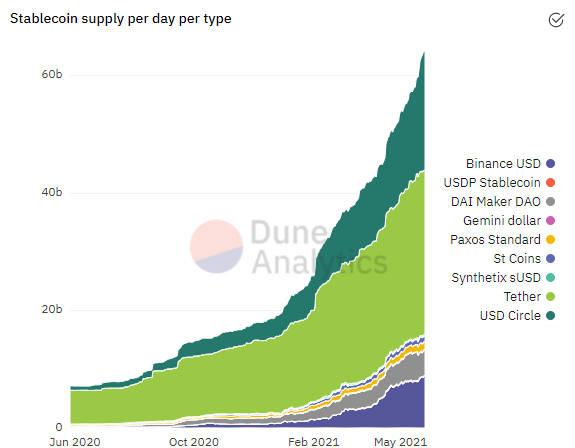
Stablecoin Supply Per Day Per Type – Dune Analytics
The leading stablecoin, Tether (USDT), was launched in 2014. The dollar-pegged stablecoin was originally built on the Bitcoin blockchain and represented a dollar held in the bank. It has come under intense scrutiny for allegations of unbacked tokens, fraud and outright conspiracy.
There is usually an uptick in stablecoin activity during extreme episodes in the cryptocurrency market, as was the case the past week, leading to the spike in Tether’s $62 billion breakthrough. Often these events enhance the ecosystem’s strength.
A second factor related to major changes in Tether’s market capitalization and other stablecoins is that it often precedes significant ramp-ups in price. For example, before the rally beginning on April 26, there had been an increase in the total supply of Tether by 43%, to almost $7 billion in circulation. It was the largest spike in Tether supply over a 6-week period since inception. Bitcoin price went on to rally nearly 30% into the May 10 high.
Conversely, in November 2018, Bitcoin price fell by almost 50%, six weeks after Tether saw its supply drop by 44%. In May 2019, following a 30% increase in Tether supply, Bitcoin rallied price from around $5,500 to over $13,000.
Based on historical precedent, the jump in the supply of stablecoins hints at a new rally for Bitcoin and the cryptocurrency complex in general. Time will only tell if it is just a bounce in a larger correction or confirms the end of the correction.
Bitcoin price bounce may need a catalyst to transition it to a sustainable rally
Bitcoin price is trading just below the 200-day SMA, and the rebound from the May 19 low has been reluctant, featuring lower volume on up days. The strategically important moving average is only the first credible resistance for BTC to overcome.
The intersection of multiple levels frames a massive obstacle for Bitcoin price that will challenge BTC for days and possibly weeks to come. The resistance includes the 38.2% Fibonacci retracement of the historic rally from the March 2020 low to the April high at $41,581, the January 8 high at $41,986, the February 28 low at $43,016 and 38.2% retracement level of the April-May decline at $43,331.
The magnitude of the resistance suggests that Bitcoin price may need a pivotal catalyst that will create the thrust to transition the rally from a bounce into a full-fledged rally.

BTC/USD daily chart
BTC still faces the prospect of more selling, particularly considering the compressed price action since the May 19 crash. Downside should be limited to the May 23 low at $31,111, but the magnet effect of $30,000 may pull it lower.
Ethereum price likely printed a correction low
Ethereum price followed last week’s 41.44% decline with a 30.44% gain from price at the time of writing, highlighted by three days of +10% gains. The feverish bounce has uncovered resistance at the 50-day SMA at $2,823 today, causing an intra-day reversal of earlier gains.
The rebound, initiated by a bullish hammer candlestick pattern on the 12-hour chart, has been accompanied by solid volume after reaching an oversold condition on the daily Relative Strength Index (RSI). Moreover, the May 23 undercut of the May 19 low has put the charts in place for a double bottom pattern with a trigger price of $3,000.
A breakout above the double bottom trigger will quickly discover resistance at the 50 twelve-hour SMA at $3,285 and the 61.8% Fibonacci retracement of the May decline at $3,369. If the rally continues, it will experience minor resistance at the 78.6% retracement before launching an assault on the all-time high at $4,384.
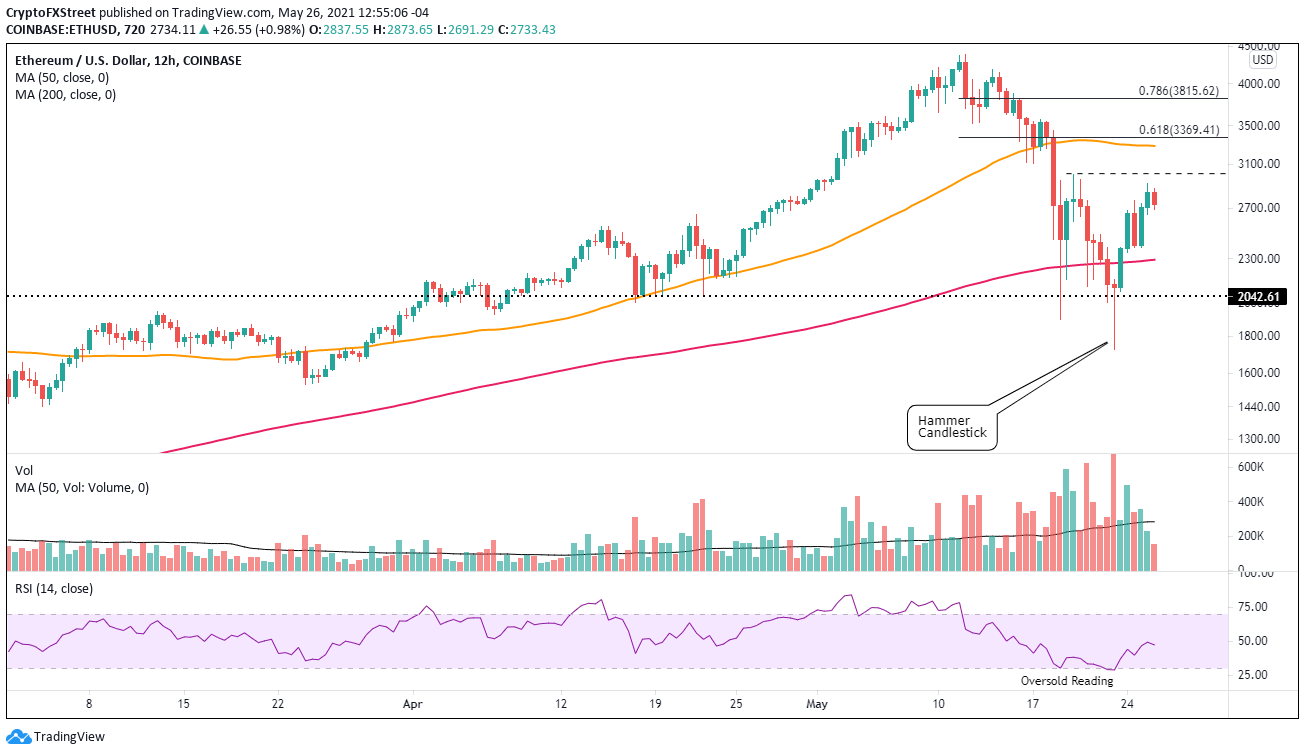
ETH/USD 12-hour chart
Renewed selling in the crypto market could push Ethereum price down to the 200 twelve-hour SMA at $2,292. ETH should not undercut the February high at $2,042 again during the bottoming process.
XRP price intentions remain unclear after bounce
XRP price closed on May 23 with a bullish hammer candlestick pattern that was effectively triggered on May 24 when Ripple traded above $0.816. The candlestick formed in the ‘legal uncertainty price range’ associated with the November 2020 high and the December 2020 low, during which the SEC case was announced.
Over the four trading days, XRP price has wrestled with the 200 twelve-hour SMA and the rising trend line from the December 2020 low around $0.930. The price action has been passive with waning volume and no demonstrable upside progress, suggesting a mild pullback may be necessary to effectively reset Ripple for a meaningful charge above the strategically crucial moving average.
If XRP price does dislodge from the magnet effect of the 200 twelve-hour SMA, it may rally to the 38.2% retracement level of the April-May decline at $1.15, but the psychologically important $1.00 may still be a factor.
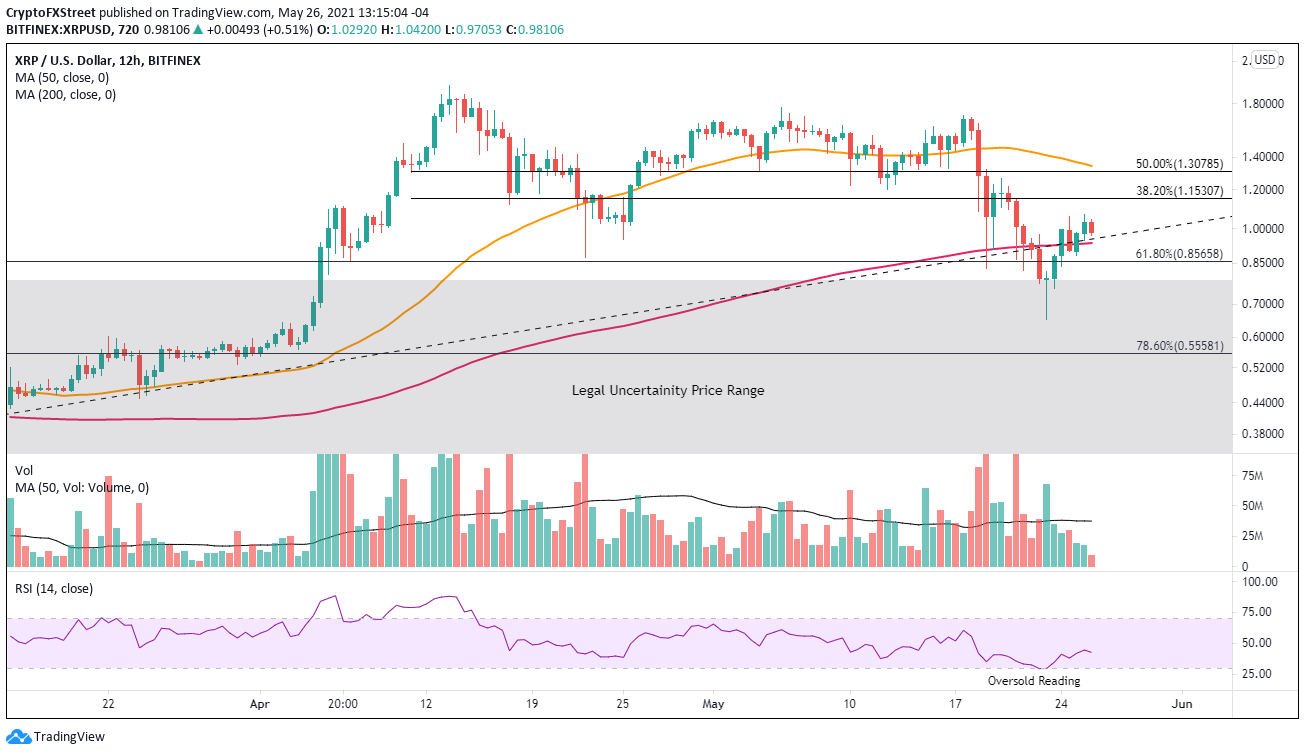
XRP/USD 12-hour chart
A reversal of fortune for XRP price could press Ripple down to the upper level of the ‘legal uncertainty price range’ at $0.780, but any further weakness should be managed before a new test of the 200-day SMA at $0.669.
