- Bitcoin price down 12% after rallying within 260 points of the formidable $41,581-$43,341 resistance level.
- Ethereum breaks support at symmetrical triangle’s lower trend line, as the decline gains traction.
- XRP price steadies above the omnipresent support of $0.76.
Bitcoin price has declined to the symmetrical triangle’s upper trend line after climbing 30% from the June 8 low, engaging the first support for the new rally attempt. Ethereum price failure at its symmetrical triangle support has raised the odds of a deeper decline moving forward. XRP price has not provided any directional clues, opting to remain range-bound.
US politics embraces cryptocurrency, searching for a new contribution channel
In an interesting twist on the cryptocurrency adoption story, the National Republican Congressional Committee (NRCC) announced on June 17 that it would begin accepting campaign contributions in cryptocurrency.
The NRCC will begin accepting cryptocurrency contributions using Bitpay, a provider of Bitcoin and other cryptocurrency payment services. The contributions will immediately be converted to USD before being deposited into the NRCC accounts. By not directly receiving the cryptocurrencies, the committee can accept donations of up to $10,000 a year, rather than just the $100 direct transfers of cryptocurrency approved by the Federal Election Commission (FEC) in a 2014 ruling.
In May, the FEC expressed their concerns about how cryptocurrencies may prevent the commission from following the flows into the US political system. By converting the cryptocurrencies to USD before taking possession of the contributions, the NRCC feels that it has facilitated the transparency requested by the FEC.
As the first national party committee to accept cryptocurrency donations, the NRCC says it “is proud to lead the charge in accepting cryptocurrency campaign contributions.”
The NRCC believes it is a creative attempt to leverage the relatively new technology to finance and better their odds of reclaiming the House in the midterm elections next year.
We are focused on pursuing every avenue possible to further our mission of stopping Nancy Pelosi’s socialist agenda and retaking the House majority, and this innovative technology will help provide Republicans the resources we need to succeed.
Bitcoin price close to triggering a death cross signal on the daily chart
No doubt, Bitcoin price manufactured one of the better rallies in the first half of June, lifting the flagship cryptocurrency 33% and within 260 points of an intimidating range of resistance. The range is constructed by the 50-day simple moving average (SMA) at $43,340, the 38.2% Fibonacci retracement of the April-May correction at $43,331, the 200-day SMA at $42,894 and the 38.2% retracement of the 2020-2021 advance at $41,581.
A death cross will likely trigger this weekend, formally solidifying the formidable resistance. It is important to note that the last death cross signal in March 2020 did not lead to a decline, but a 35% decline followed the one in 2019.
After striking the upside resistance, Bitcoin price has retraced 12% of the new rally and nears the symmetrical triangle’s upper trendline around $36,700. It was anticipated and represents the first test for the emerging rally.
A close below the June 12 low of $34,635 will signal that Bitcoin price may continue retracing the rally to the triangle’s lower trend line around $31,509. The lower trend line is followed by the June 8 low of $31,004 and then by the May 19 correction low of $30,000.

BTC/USD daily chart
Only a daily close above the 50-day SMA at $43,340 would alter the neutral outlook for Bitcoin price. However, if it occurs, BTC investors can reorient their projections to the upside, with the all-time high of $64,899 being the focal point.
Ethereum price lackluster action is resolving, adding clarity
Ethereum price had sketched an uneventful path, with a progressively narrow trading range. Still, the June 15 break of the symmetrical triangle’s lower trend line has immediately exposed ETH to a bearish outcome in the days or weeks ahead.
Critical to preventing a larger decline is the merger of the June 12 low of $2,259 with the 50% retracement of the 2020-2021 advance at $2,237. A daily close below will introduce Ethereum price to a more significant decline, likely to the confluence of the 200-day SMA at $1,849 with the anchored volume-weighted average price (anchored VWAP) at $1,830, equating to an 18% decline from the current price.
Speculators cannot overlook the potential for a sweep of the May 23 low of $1,728.
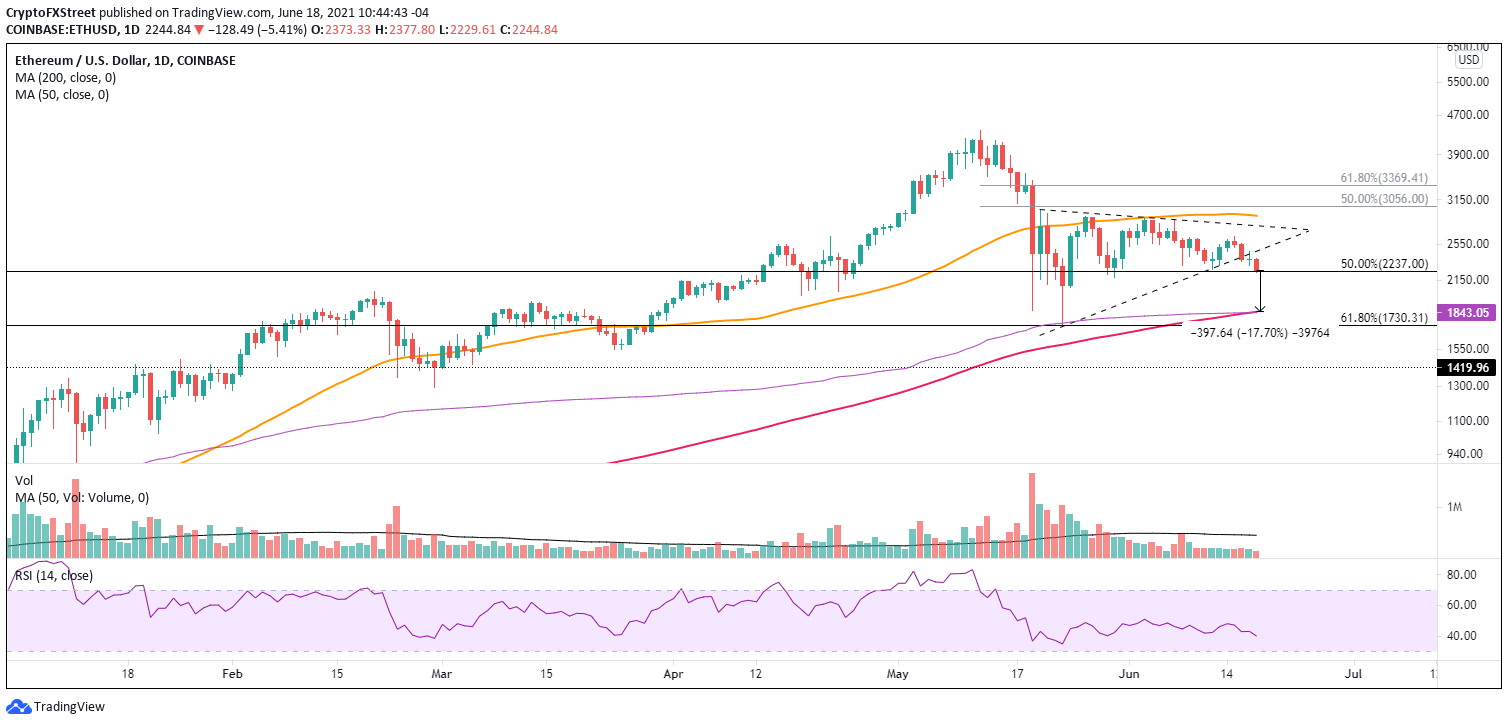
ETH/USD daily chart
It would take a daily close above the June 15 high of $2,640 to realistically entertain a sustainable thrust higher for Ethereum price. A close above the 50-day SMA at $2,919 would be welcome confirmation of a new, viable uptrend with ETH sights set on the all-time high of $4,384.
A potential disruption for the bearish ETH outlook is the upcoming London hard fork update in July to address energy use and higher transaction fees. Excitement about the update may limit any further decline and place the foundation for Ethereum price to reengage with the earlier rally attempt.
Nevertheless, despite trading down 50% from the May 12 high of $4,384, Ethereum price still is not attracting a solid bid. A reminder that ETH investors may need a considerably lower price to stimulate a new wave of commitment and emotion.
XRP price still waiting for a clue or trigger
XRP price has displayed a similar passiveness and lack of direction as many altcoins. Ripple was not inspired by the 30% rally in Bitcoin price, instead favoring to be range-bound between two imposing levels, the neckline of an inverse head-and-shoulders pattern at $0.76 and the psychologically important $1.00.
The range has not been accompanied by any signs of accumulation or distribution, raising the probability that XRP price many remain locked in the governing price range for the foreseeable future.
With XRP price at an inflection point, it is imperative to consider both outcomes. On the long side, Ripple is clear of any obstacles until $1.00. A daily close above $1.00 would introduce new bullish opportunities and targets, including a rally to the confluence of the 38.2% retracement of the May correction at $1.14 with the declining 50-day SMA, also at $1.14.
Ripple investors should consider timeliness and use pullbacks to the $0.76 price area to initiate positions. It is a precise risk level if the trade goes against them.
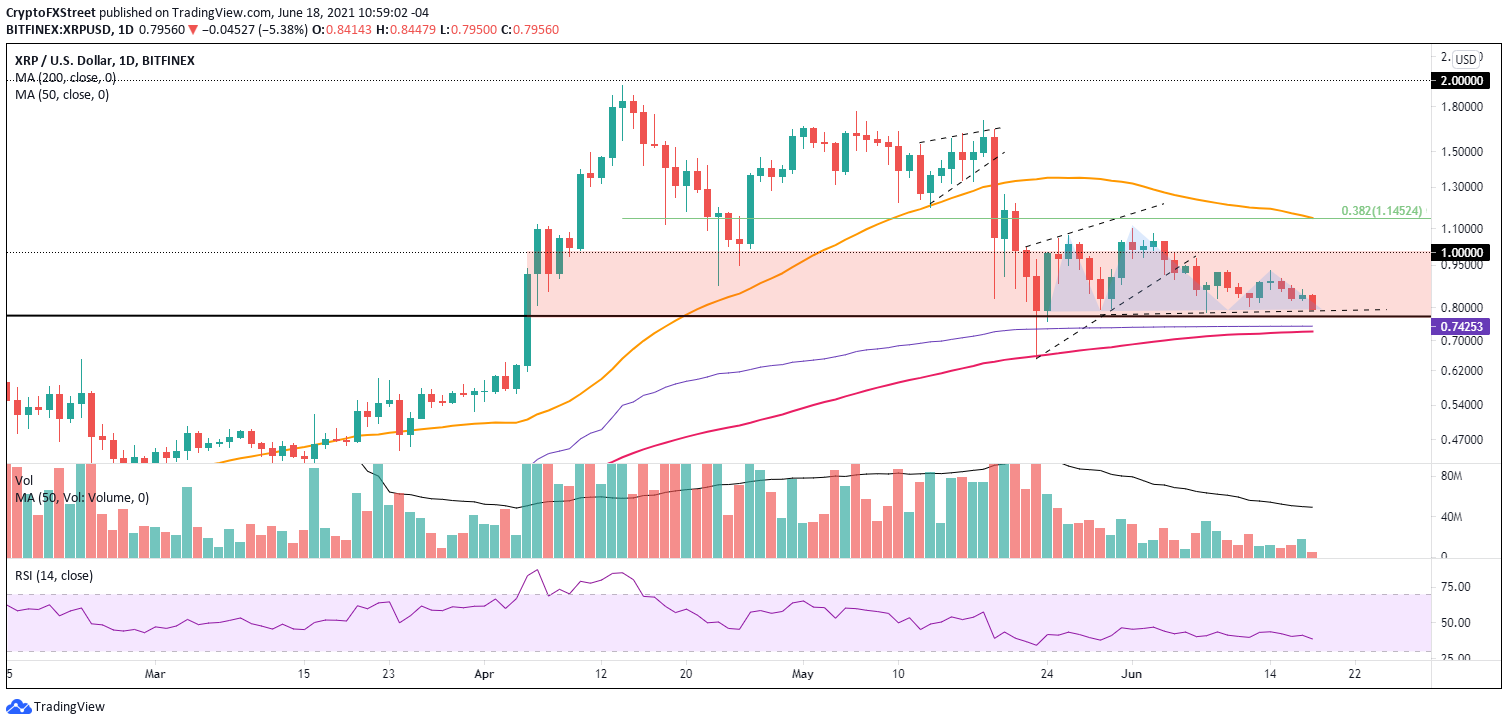
XRP/USD daily chart
A bearish view for XRP price is complemented by a minor head-and-shoulders pattern with the neckline near $0.76, bolstering the inflection point’s importance.
If the neckline and $0.76 melt away on a daily closing basis, Ripple investors can contemplate bearish outcomes for XRP price. However, it is critical to note that standing in front of a test of the May 23 low of $0.65 is the union of the anchored VWAP at $0.74 with the 200-day SMA at $0.72, suggesting that extreme bearish forecasts may be shortsighted.
To close, the importance of the SEC case against Ripple should not be dismissed during the consideration of XRP price projections. As most spectators anticipate, the digital asset will not go public and will not be available for trading on many major cryptocurrency exchanges until there is a settlement. Both things are price negative while the case remains active.
