- Ripple introduces an app that will allow direct transfers between messaging app users.
- Ethereum loses momentum after the previous week’s strong gains.
- The BTC/USD pair lurks near the $12000 level and keeps options to reach new yearly highs.
At the same time that the crypto market seems to be in the middle of a slowdown, the news related to the crypto industry continues to add up to positive news.
Ripple Ltd, the company that manages XRP, is introducing wonderful applications that can lead to the adoption of XRP as a global value transfer system.
Ripay, the name of the App, has been presented at the PayID Hackaton event, an event hosted by Ripple.
Ripay would allow the integration of the Ripple network, XRP Ledger, into any existing and future messaging App. Users would be able to send money to each other with a simple, literal message such as “Send xxx money to Mark”. The millions of users of these messaging apps every day are a huge potential market.
Facebook is also moving forward with a new version of its Libra project through the financial division of the company Facebook Finance. In an attempt to offer a reliable product to the general public, Facebook proposes to support its electronic currency with a basket of stable coins pegged to USD, EUR or JPY.
Market fundamentals
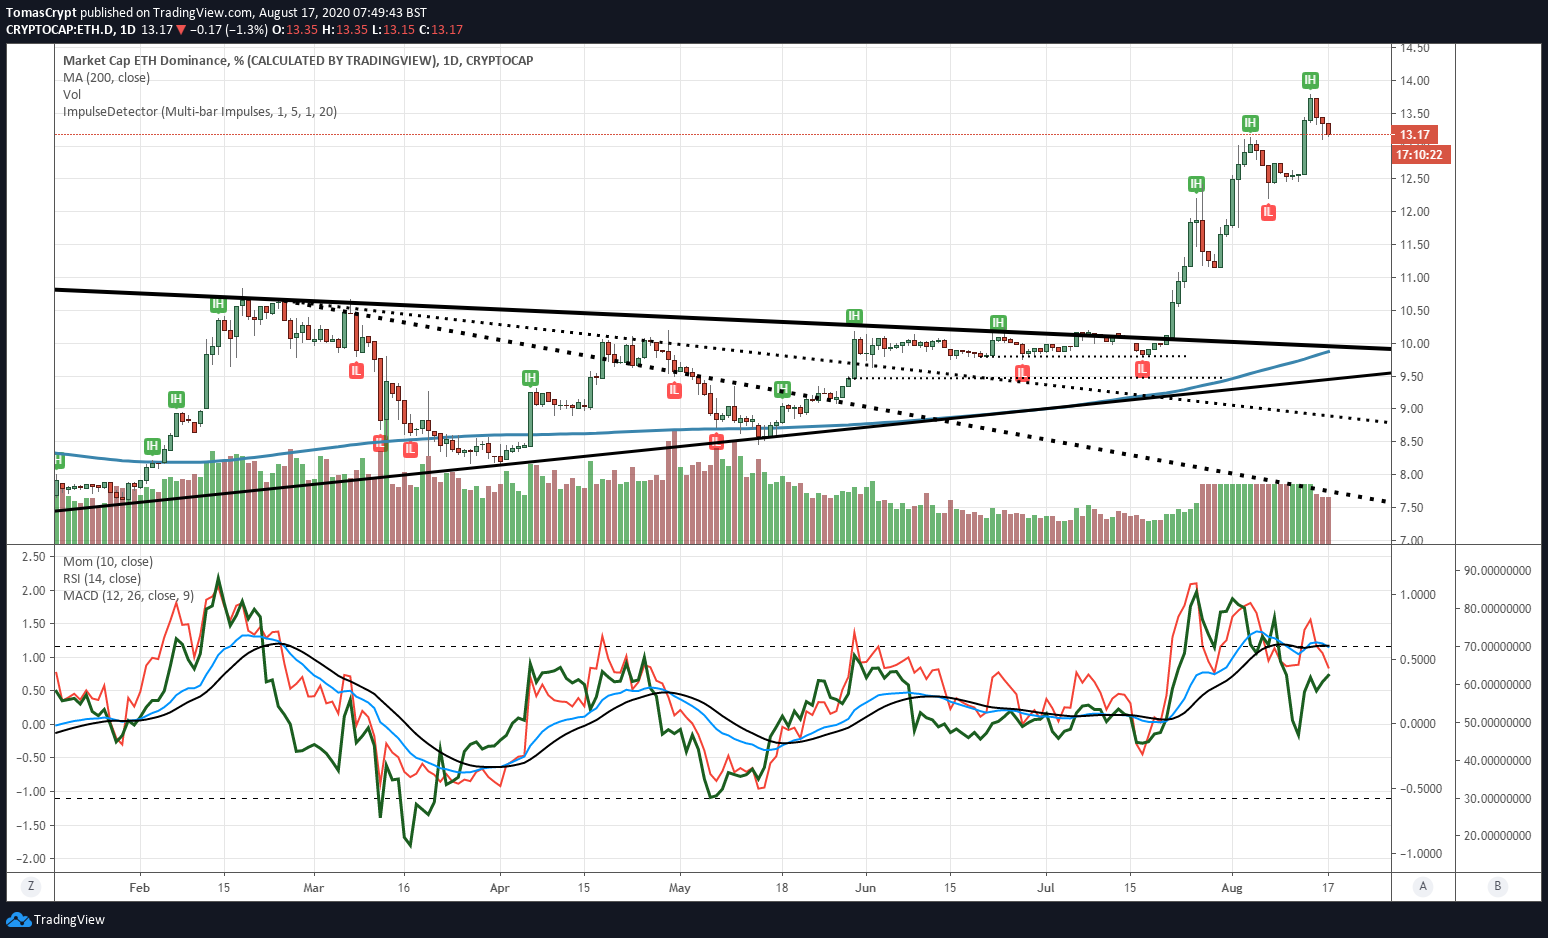
Crypto segment dominance charts show how Ethereum is losing momentum after the significant rise in recent months. Ethereum has gone from below 10% market share to above 13.5%.
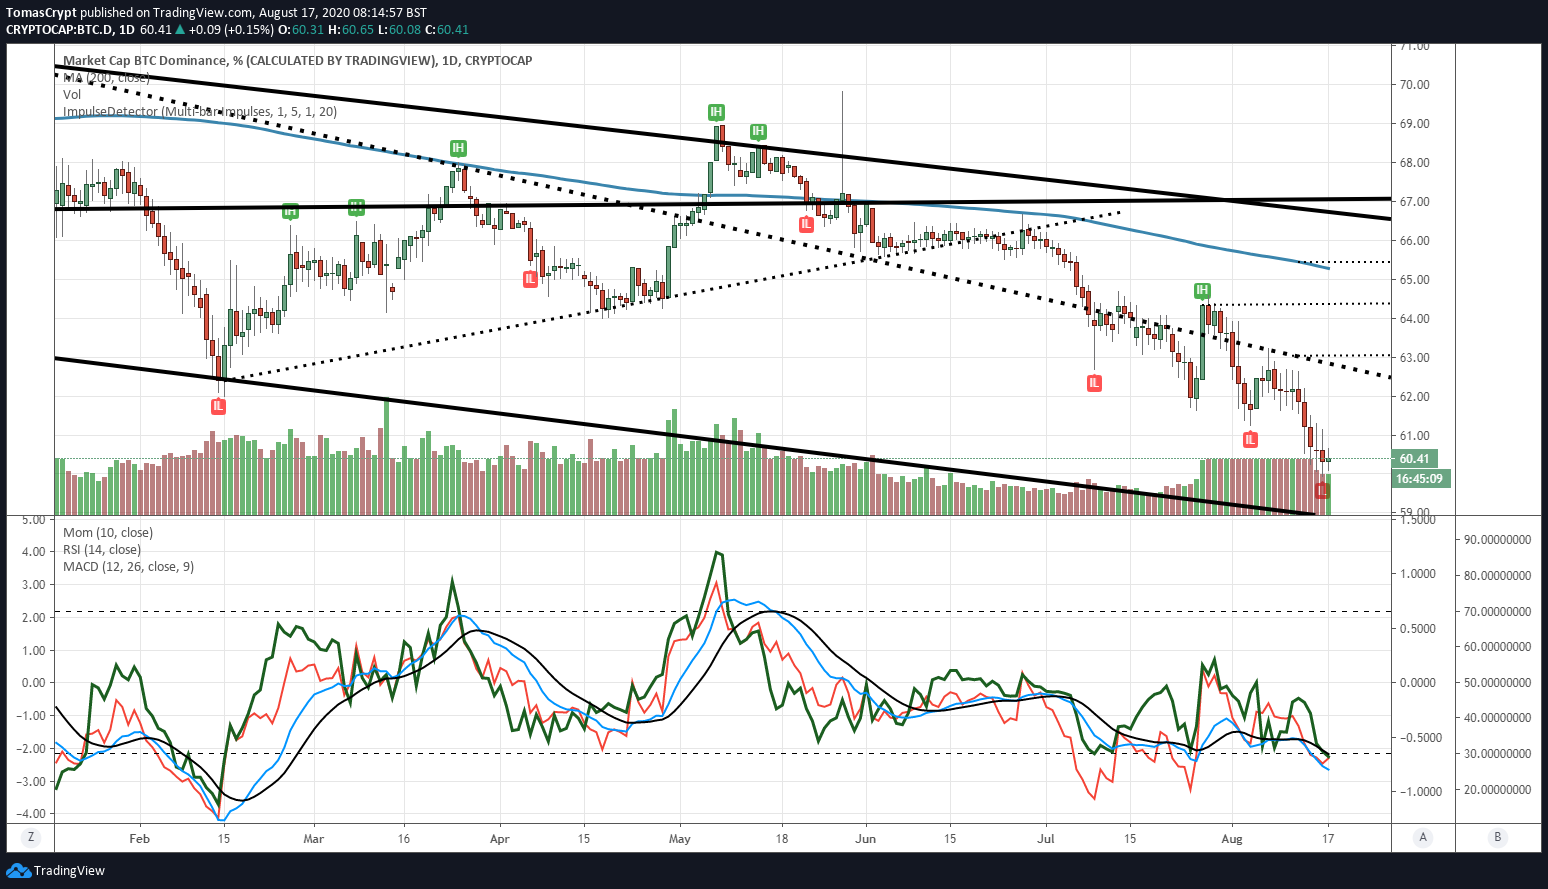
The Bitcoin dominance chart shows signs of changing direction, after a long run down from 69% market share to the current level of 60%.
Market sentiment is once again on the rise, reaching the 83rd level today – an extreme level of greed. This level of optimism implies price corrections in the short term.
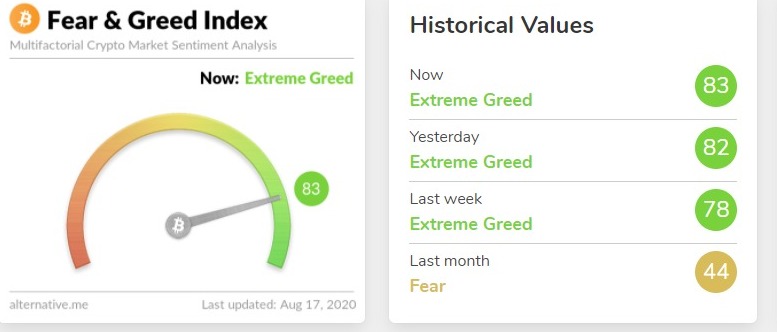
Source: alternative.me
ETH/BTC Daily Chart
The ETH/BTC pair is currently trading at 0.0357 and has already dropped three days in a row from Friday’s relative high of 0.038.
Above the current price, the first resistance level is at 0.0367, then the second at 0.0373 and the third one at 0.039.
Below the current price, the first support level is at 0.035, then the second at 0.0332 and the third one at 0.0316.
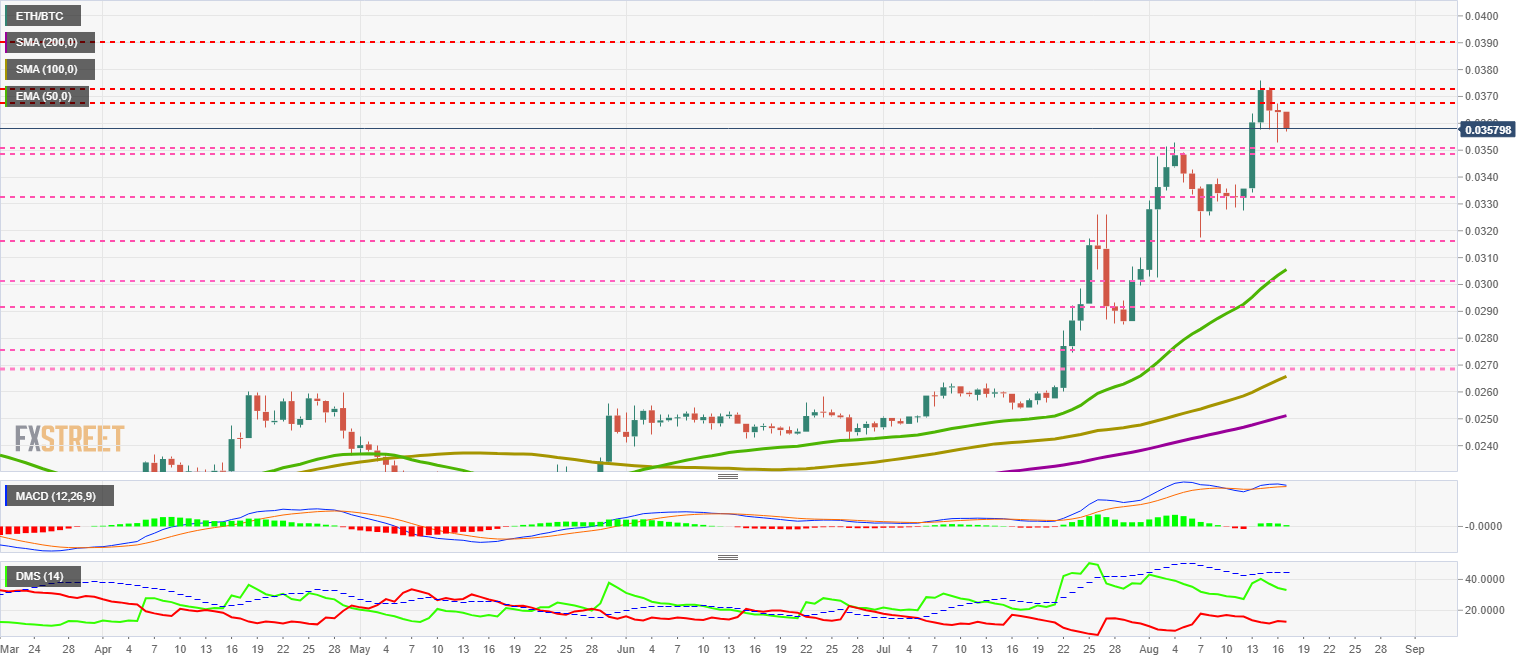
The MACD on the daily chart indicates that there is a bearish cross coming for this week starting today. This time the cross should be valid and bring the price of the ETH/BTC pair significantly lower.
The DMI on the daily chart shows the bulls losing momentum quickly, while the bears are still not bright and are holding at levels similar to last week’s.
BTC/USD Daily Chart
The BTC/USD pair is currently trading at $11809 and continues to stalk the $12000 resistance level as predators target their prey. BTC/USD did not follow the last uptrend in the Altcoin segment, and it will eventually do so.
Above the current price, the first resistance level is at $12000, then the second at $14000 and the third one at $17200.
Below the current price, the first support level is at $11290, then the second at $10670 and the third one at $9850.
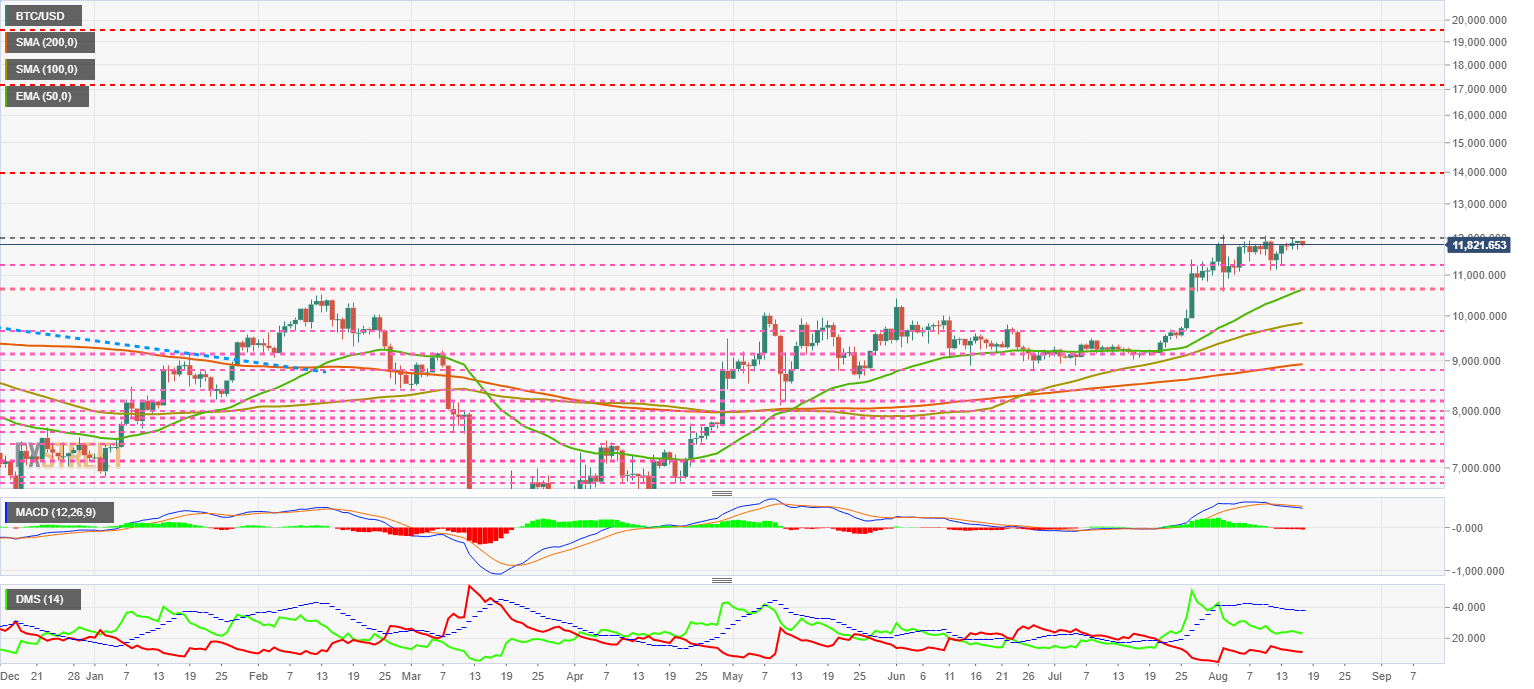
The MACD on the daily chart continues to cross downward but with little inclination or separation between the moving lines. The current setup allows for sharp movements both up and down.
The DMI on the daily chart shows the bulls are losing strength, something the bears are following. It seems that neither buyers or sellers are clear about the direction of the next move.
ETH/USD Daily Chart
The ETH/USD pair is currently trading at the price level of $425 and leaves behind the relative highs of $440. The technical structure makes a consolidation phase for ETH/USD very likely after five months of continuous gains.
Above the current price, the first resistance level is at $440, then the second at $460 and the third one at $480.
Below the current price, the first support level is at $385, then the second at $350 and the third one at $315.
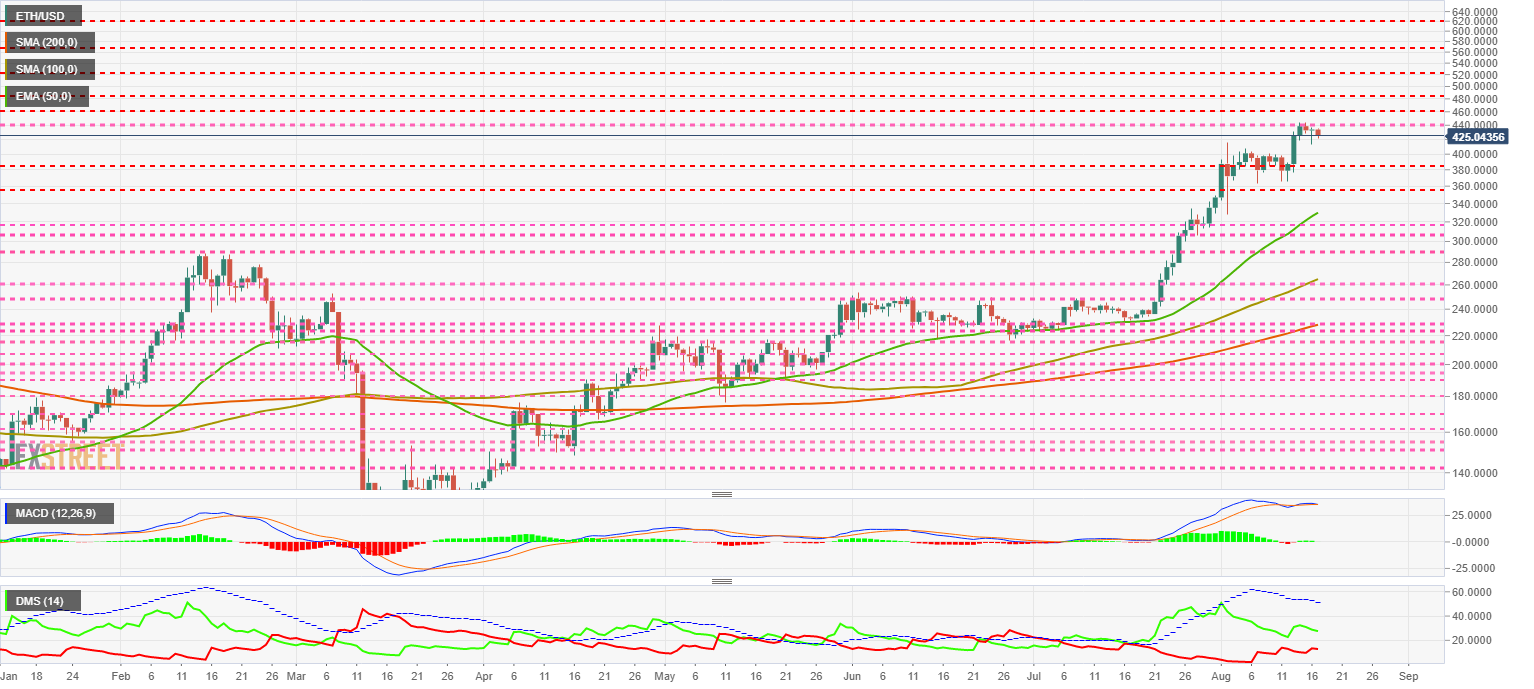
The MACD on the daily chart shows a flat profile with a natural tendency towards the short term bearish cross.
The DMI on the daily chart shows the bears losing strength as the bears increase their strength. We will likely see a collision between the two sides of the market this week.
XRP/USD Daily Chart
The XRP/USD pair is currently trading just below at the price level of $0.300, the critical level to maintain the upward momentum of the past few weeks.
Above the current price, the first resistance level is at $0.32, then the second at $0.336 and the third one at $0.367.
Below the current price, the first support level is at $0.30, then the second at $0.288 and the third one at $0.268.
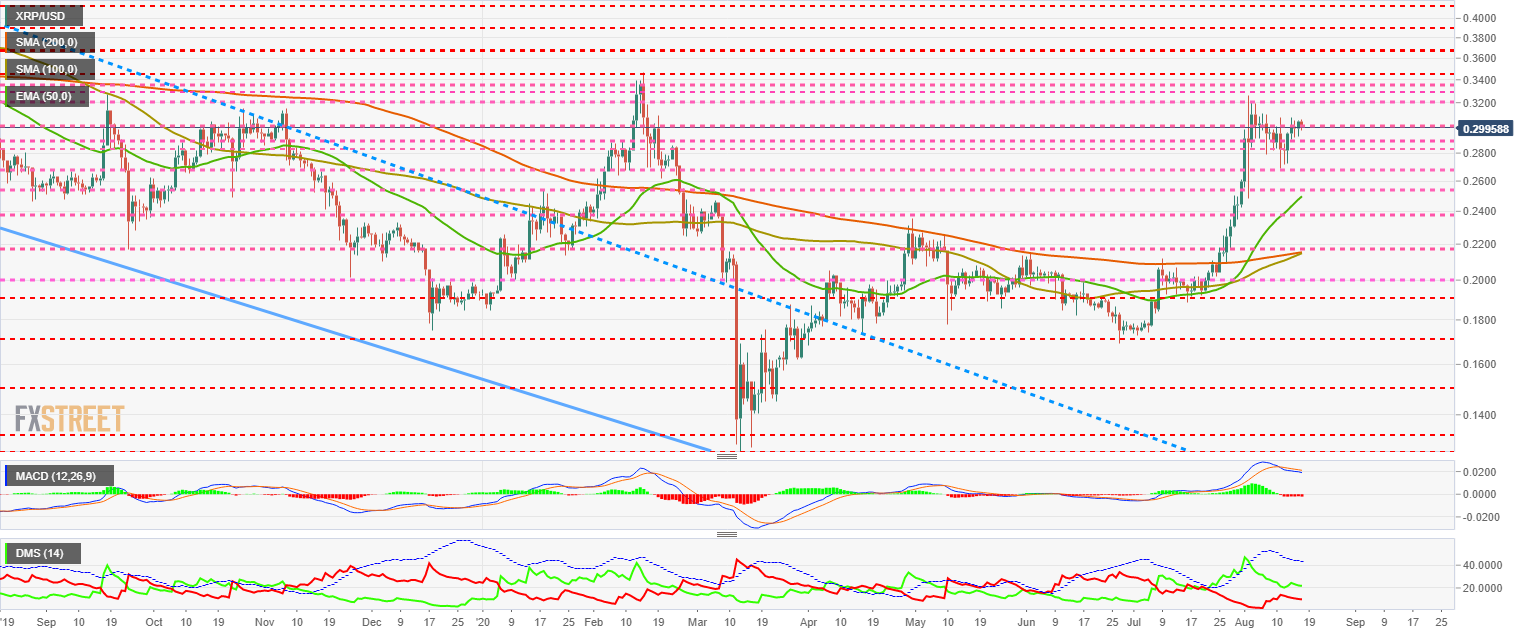
The MACD on the daily chart increases the bearish profile from the previous horizontal position. Although a further upward movement has good chances, the most likely development is downward.
The DMI on the daily chart shows that the bulls are resuming their downward movement after the previous week’s pause. Bears are also moving downward and are not relying on the theoretical weakness in the XRP/USD pair.
