- Stablecoins account for the majority of transactions in the Ethereum network.
- With BTC and XRP in bullish terrain, Ether is acting as lag for the Top 3.
- Cryptos’ technical prospects are worsening with every passing day, consuming capital without moving upwards.
The crypto board is waiting for Ethereum to break higher and launch the market in the race for new all-time highs.
Precisely, the Ethereum network stands out in recent days because of the dominance that stablecoins have acquired in the total volume of transactions that run on the network sponsored by Vitalik Buterin.

According to data available on decentralized Exchanges such as dex.watch, the tokens that topped the Top 5 by volume (ETH) in the past 24 hours are Dai Stablecoin (8216 ETH), Synthetix (3121 ETH), Unibright UBT (ETH 1862), USDC (1726 ETH) and sUSD (1037 ETH).
During the same period, the network has transacted only 601 Ethers.
The value of a Dex network weights its level of usage, and the more projects using that same network, the higher the stability and reliability. The collateral for all of these Defi applications is the Ether, in this case, modelled as the utility base for a business that supports millions of dollars in transactions per day.
ETH/BTC Daily Chart
ETH/BTC is currently trading at the price level of 0.01873 (+0.38%) and is losing the support of the EMA50. The opening below the exponential moving average puts the current price range at risk and opens the door to declines for support at the 0.018 level.
Above the current price, the first resistance level is at 0.01897, then the second at 0.0195 and the third one at 0.020.
Below the current price, the first support level is at 0.0187, then the second at 0.018 and the third one at 0.017.
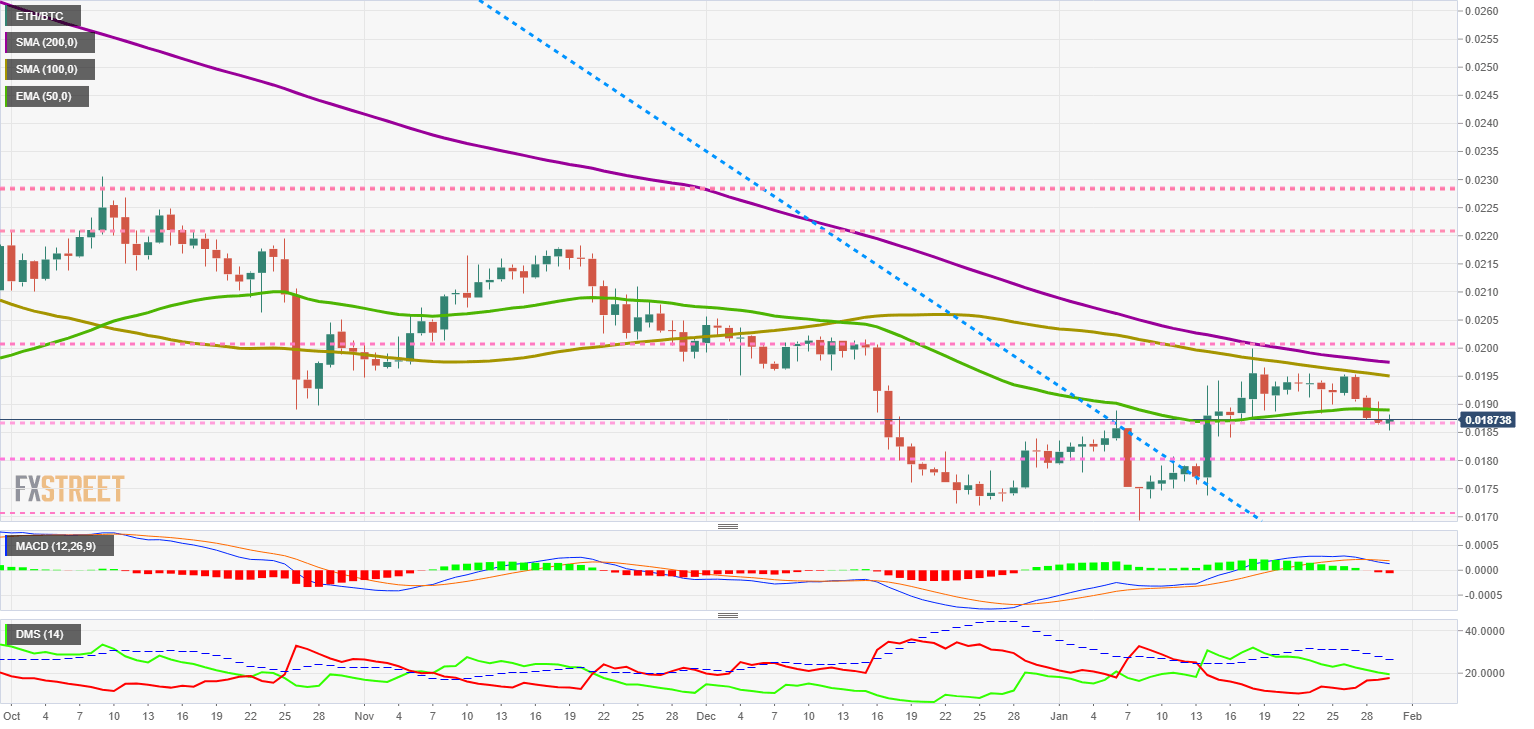
The MACD on the daily chart completes the bearish cross but remains in the bullish zone of the indicator. The slope suggests consolidation rather than a change in the direction of the trend.
The DMI on the daily chart shows both sides of the market are on the verge of a collision, and it is now clear who will control the pair in the coming sessions.
BTC/USD Daily Chart
BTC/USD is currently trading at $9,328 (+0.45%) after finding support at the $9,150 level. The decline in the price after the upward break of the bearish trend line is being minimal, a sign of buying interest.
Above the current price, the first resistance level is at $9,500, then the second at $10,600 and the third one at $11,250.
Below the current price, the first support level is at $9,150, then the second at $8,900 and the third one at $8,550.
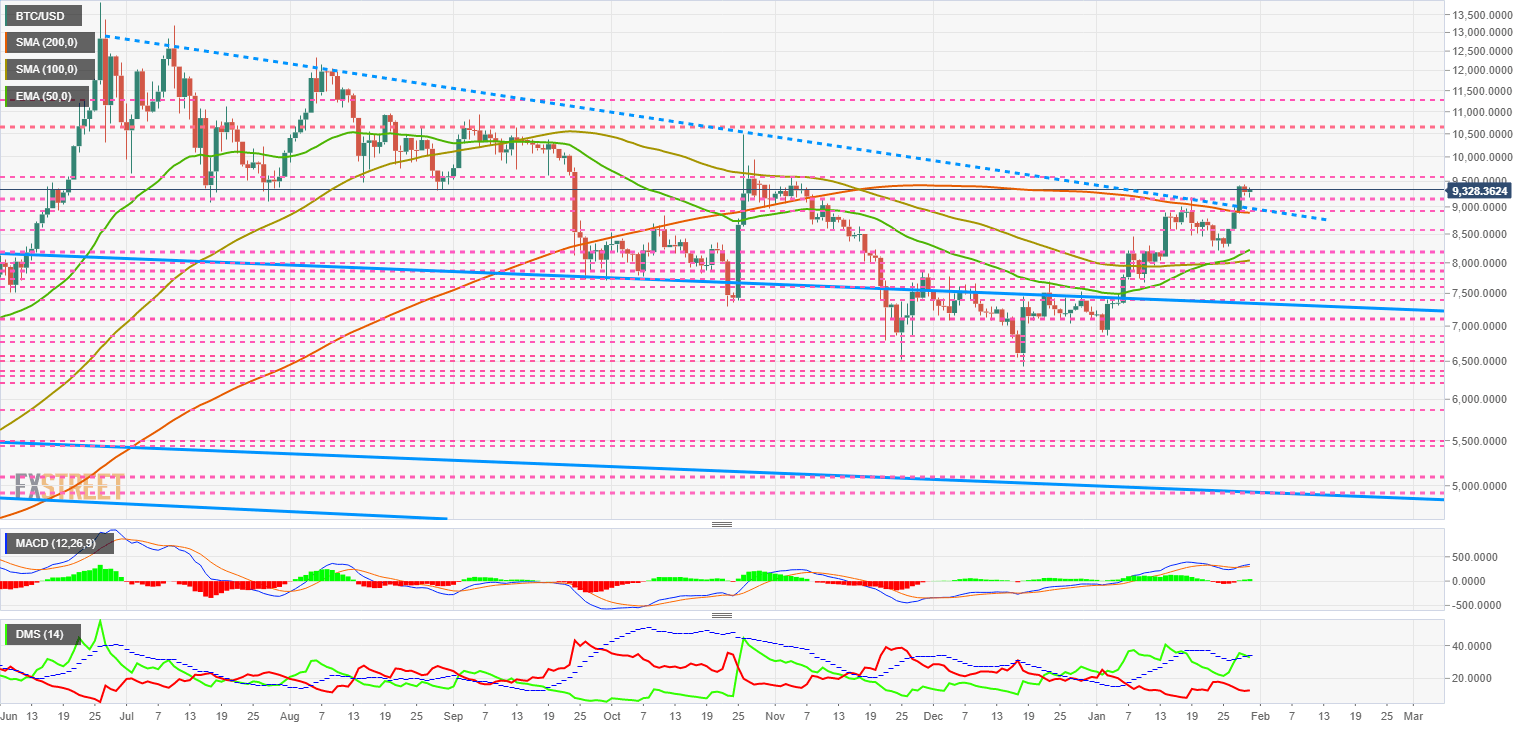
The MACD on the daily chart shows that the bullish cross is active again, although it is not getting an opening between the lines to ensure the continuity of the movement.
The DMI on the daily chart does show a clear bullish pattern. The bulls are moving back above the ADX line, ensuring upward movement as long as this condition remains in place. The bears stay at low levels and do not risk the domination of the buying side.
ETH/USD Daily Chart
ETH/USD is currently trading at $175 (+0.89%) on the third day of the SMA200 barrier for the Ether. The full bullish scenario, not only for Ether but for the whole market, is $9 higher. It looks close, but it will not be easy.
Above the current price, the first resistance level is at $180, then the second at $184 and the third one at $190.
Below the current price, the first support level is at $170, then the second at $160 and the third one at $155.

The MACD on the daily chart is crossing back up, but the bullish profile is so slight that it is more realistic to consider it as a neutral bullish move. As a secondary data point, it is a good idea to consider the height of the indicator from the neutral zone.
The DMI on the daily chart shows that the bulls are currently leading ETH/USD. The bears are rebounding upwards, but are still far from being able to contest the leadership on the buying side.
XRP/USD Daily Chart
XRP/USD is currently trading at $0.2360 (+0.37%) after recovering from the sales that have appeared during the Asian session. The $0.24 level is shaping up as an extreme resistance for the XRP advance.
Above the current price, the first resistance level is at $0.24, then the second at $0.253 and the third one at $0.26.
Below the current price, the first support level is at $0.225, then the second at $0.215 and the third one at $0.20.
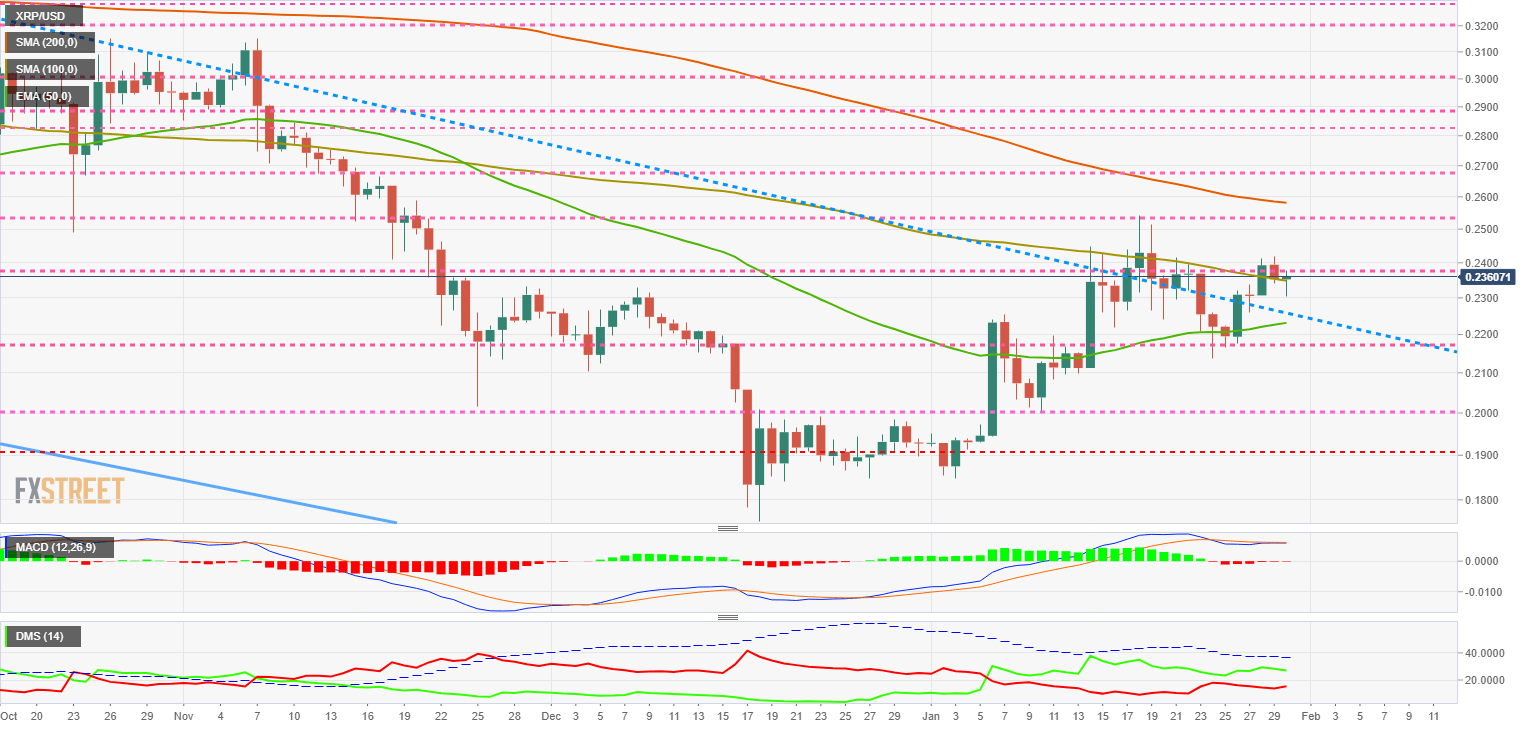 The MACD on the daily chart is entirely horizontal with the two lines at the same level. The MACD on the daily chart is utterly flat with the two lines on the same level. This profile does not provide any information in the short term, but it does convey weakness in XRP/USD.
The DMI on the daily chart shows that the process of moving closer to the market continues.
Get 24/7 Crypto updates in our social media channels: Give us a follow at @FXSCrypto and our FXStreet Crypto Trading Telegram channel
