- XRP squeezes up for the first time since June.
- Bitcoin fulfills a pattern already seen in 2017.
- Ethereum continues to rise and faces significant levels of resistance.
The arrangements for a possible Altcoins season continue with the fantastic bullish development that Ethereum is showing.
Yesterday it pierced the 50-period exponential moving average with ease and relentlessly headed towards the $200 level.
By contrast, Bitcoin continues to get stuck below the main moving averages and gives the sense that the current situation will need a jolt to get out of it.
The market expects the resolution to this bottleneck convinced that without Bitcoin’s participation it will be difficult to consolidate gains in the Altcoin niche. But recent history does not support this theory.
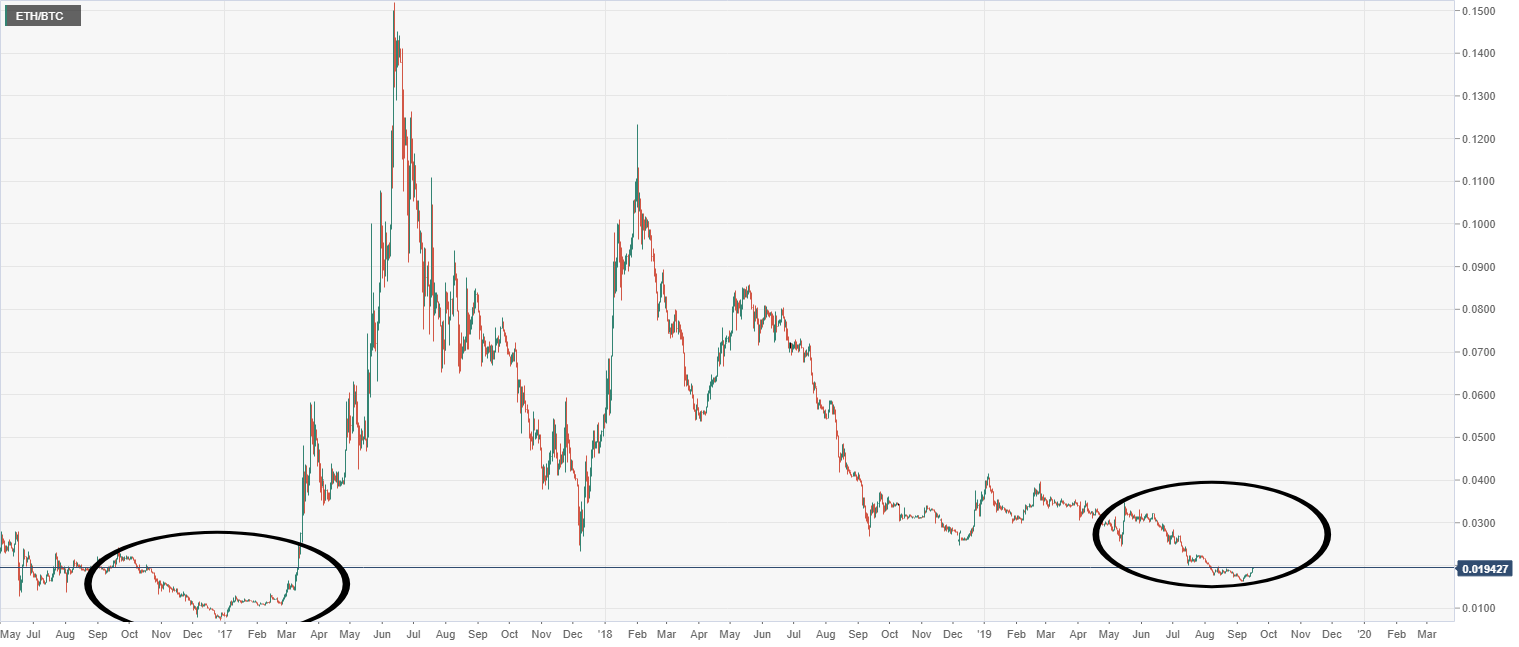
In December 2016 the technical situation of the ETH/BTC pair was similar to the current one. After a few months of a bad Ethereum behavior against Bitcoin, the pair flipped over and regained the exponential moving average of 50 periods.
After this conquest, there were two months of consolidation, Ethereum performed much better than Bitcoin, a process that culminated with Bitcoin over $19,000 and Ethereum over $1,300.
ETH/BTC Daily Chart
The ETH/BTC is currently trading at the price level of 0.01946 and lends itself to breaking yesterday’s high.
Above the current price, the first resistance level is at 0.020, then the second at 0.21 and the third one at 0.22. The ideal scenario would be to overcome these three price levels and consolidate them, which would allow moving averages to be set to rise in a short space of time.
Below the current price, the first support level is at 0.019, then the second at 0.0186 and the third one at 0.018.
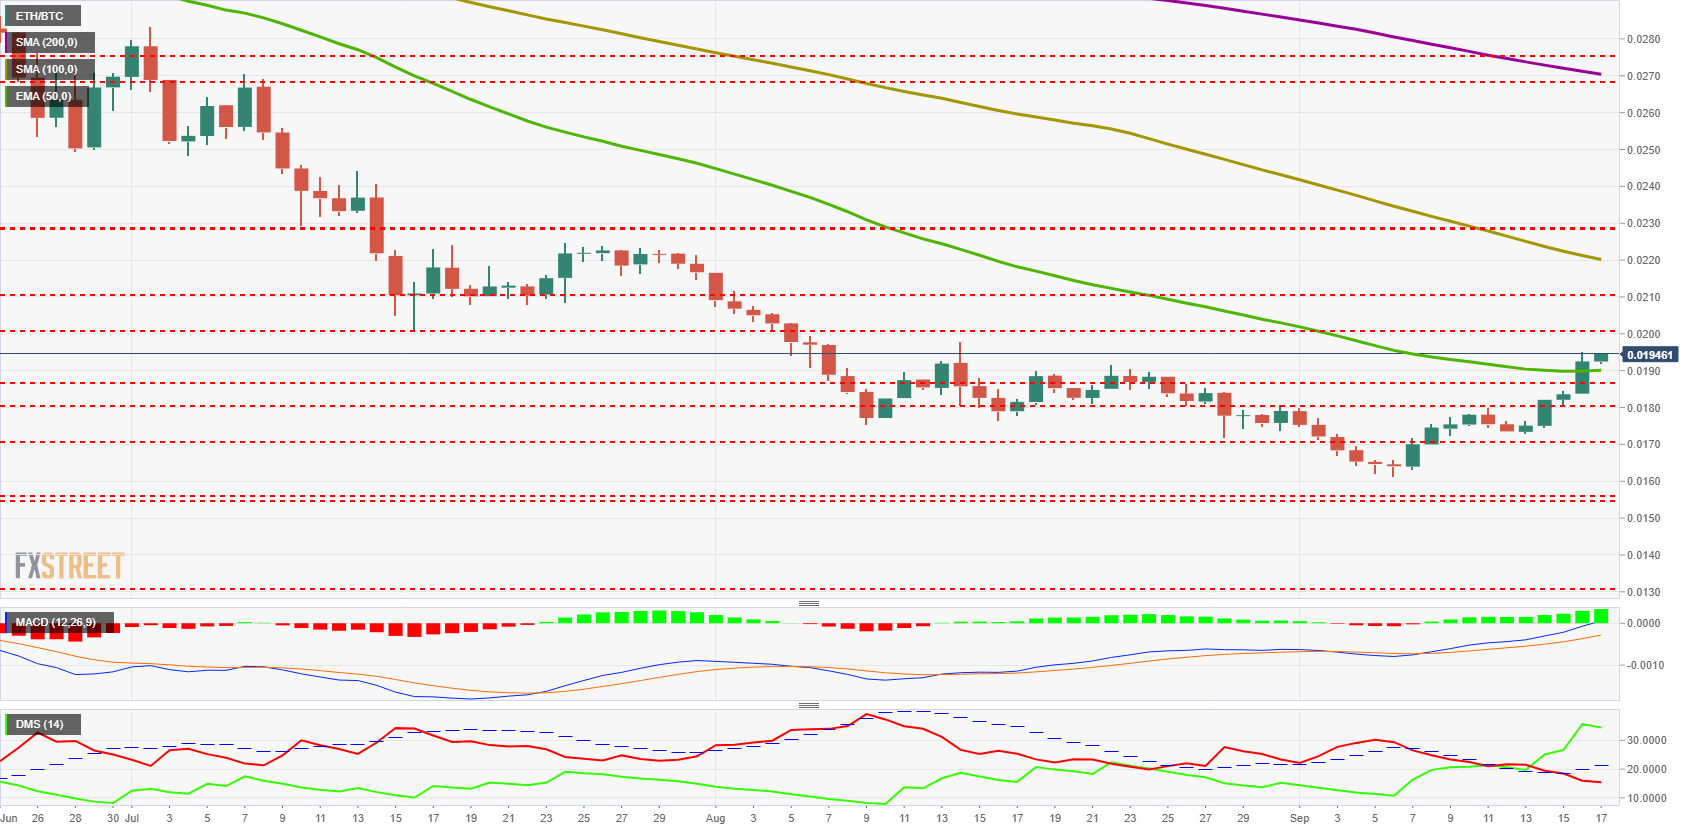
The MACD on the daily chart crosses the neutral level upwards with the fast average, which will drag the slow average and confirm a transition to the bullish side of the ETH/BTC pair. The bullish slope and opening between the lines are improving, increasing the chances of a continuation of the bullish trend.
The DMI on the daily chart shows the bulls losing some momentum while the bears continue to lose strength, albeit at a slower pace. The structure is strongly bullish in the short term.
BTC/USD Daily Chart
The BTC/USD pair is currently trading at the $10,169 price level. The 50-period exponential average and the 100-period simple average blocks it upside development.
The chart structure is not favorable in the short term, as the 200-period moving average still moves around $8,000, and it will take several days for everything to set up in bullish mode again.
Above the current price, the first resistance level is at $10,300, then the second at $10,650 and the third one at $11,300.
Below the current price, the first support level is at $9,650, then the second at $9,150 and the third one at $8,800.
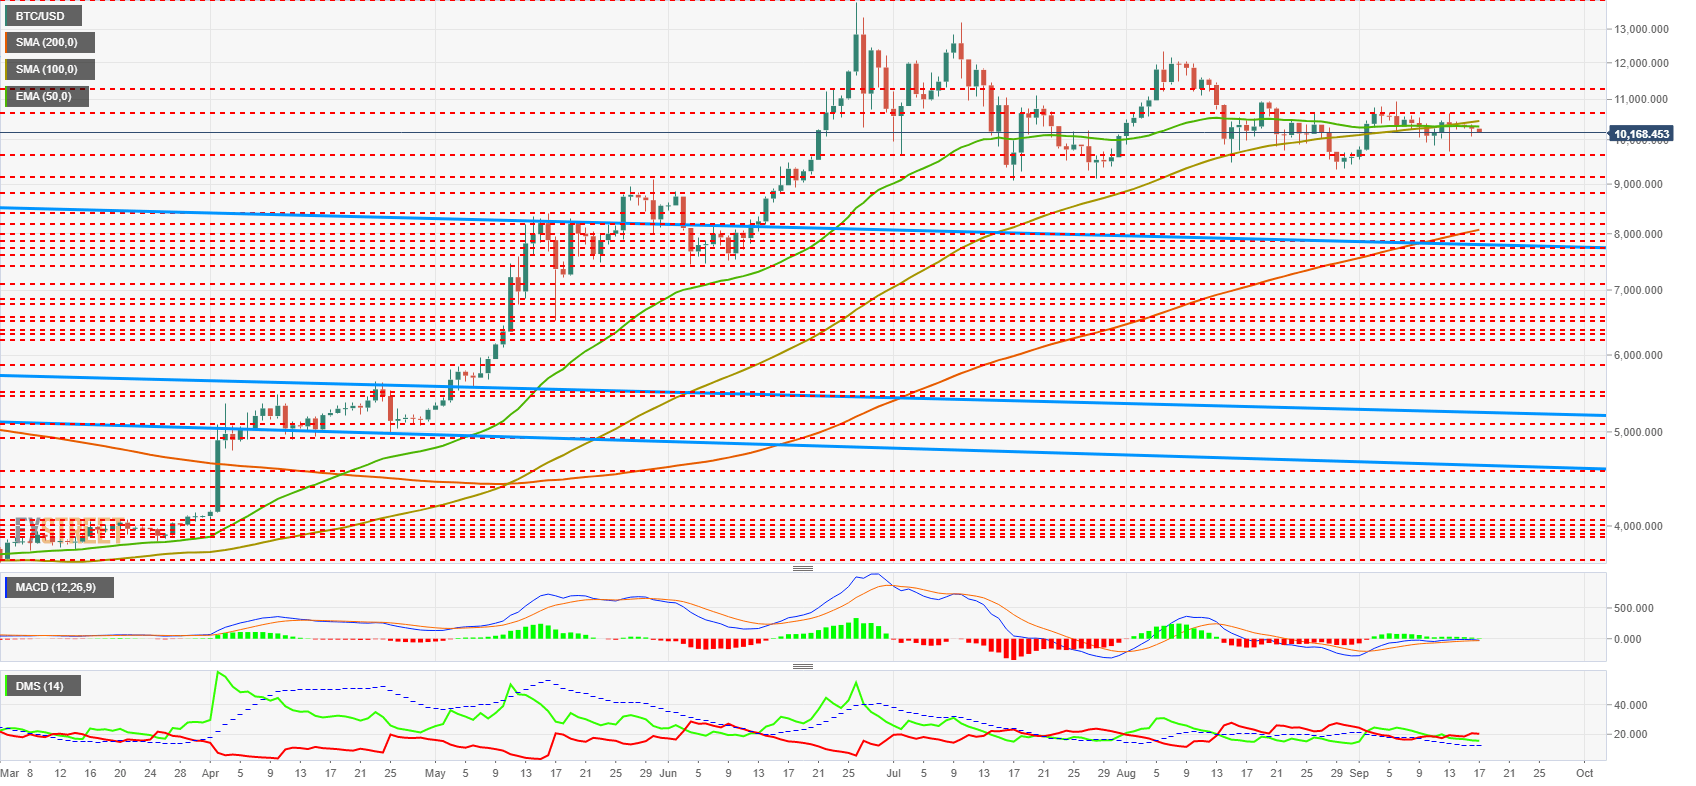
The MACD on the daily chart reliably shows the price situation. The moving averages that make up this indicator are pushing against level 0 with no option to overcome this barrier.
The DMI on the daily chart shows us how the bears maintain control of the pair with little advantage over the bulls. The ADX line goes to minimum levels not seen since the end of 2018.
ETH/USD Daily Chart
The ETH/USD is currently trading at $198.24 and is openly declaring its intention to move above the $200 level today.
The chart structure is potentially very bullish, although some difficulties are announced in the short term as we will see below.
Above the current price, the first resistance level is at $200, then the second at $208 and the third one at $215.
Below the current price, the first support level is at $195, then the second at $190 and the third one at $180.
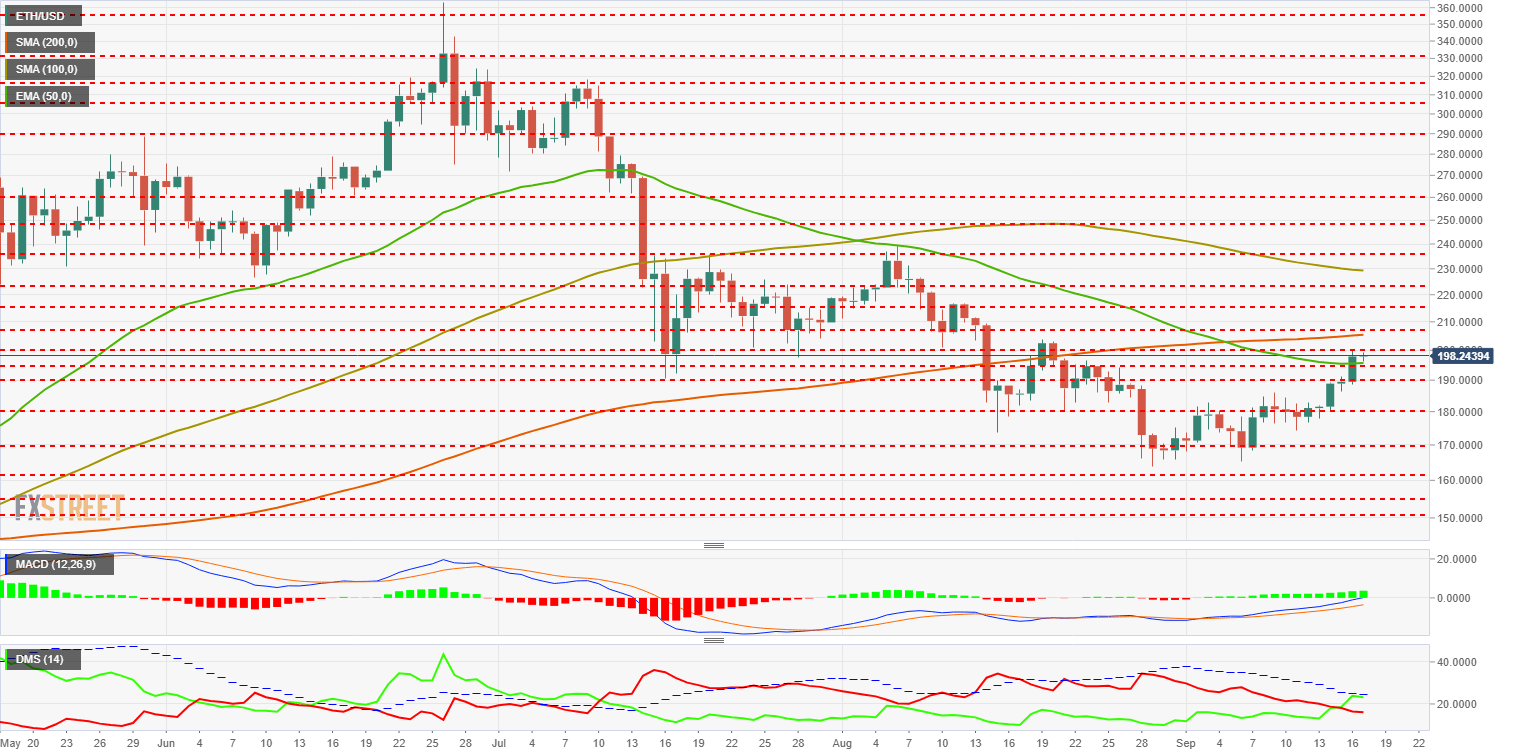
The MACD on the daily chart is trying to cross upwards the zero level of the indicator. This type of transit usually slows the current trend.
The DMI on the daily chart shows how yesterday the bulls failed to cross the ADX line upwards. Until this cross occurs, the bullish trend will be minimal. Bears continue to fall but may try to regain leadership in the face of bullfighting problems.
XRP/USD Daily Chart
The XRP/USD is currently trading at the $0.265 price level and is heading towards its third attempt so far this month to breach the price congestion resistance level at $0.267.
The chart structure of the XRP/USD is favorable in the short term, a situation that has not occurred since the beginning of August.
Above the current price, the first resistance level is at $0.271, then the second at $0.28 and the third one at $0.283.
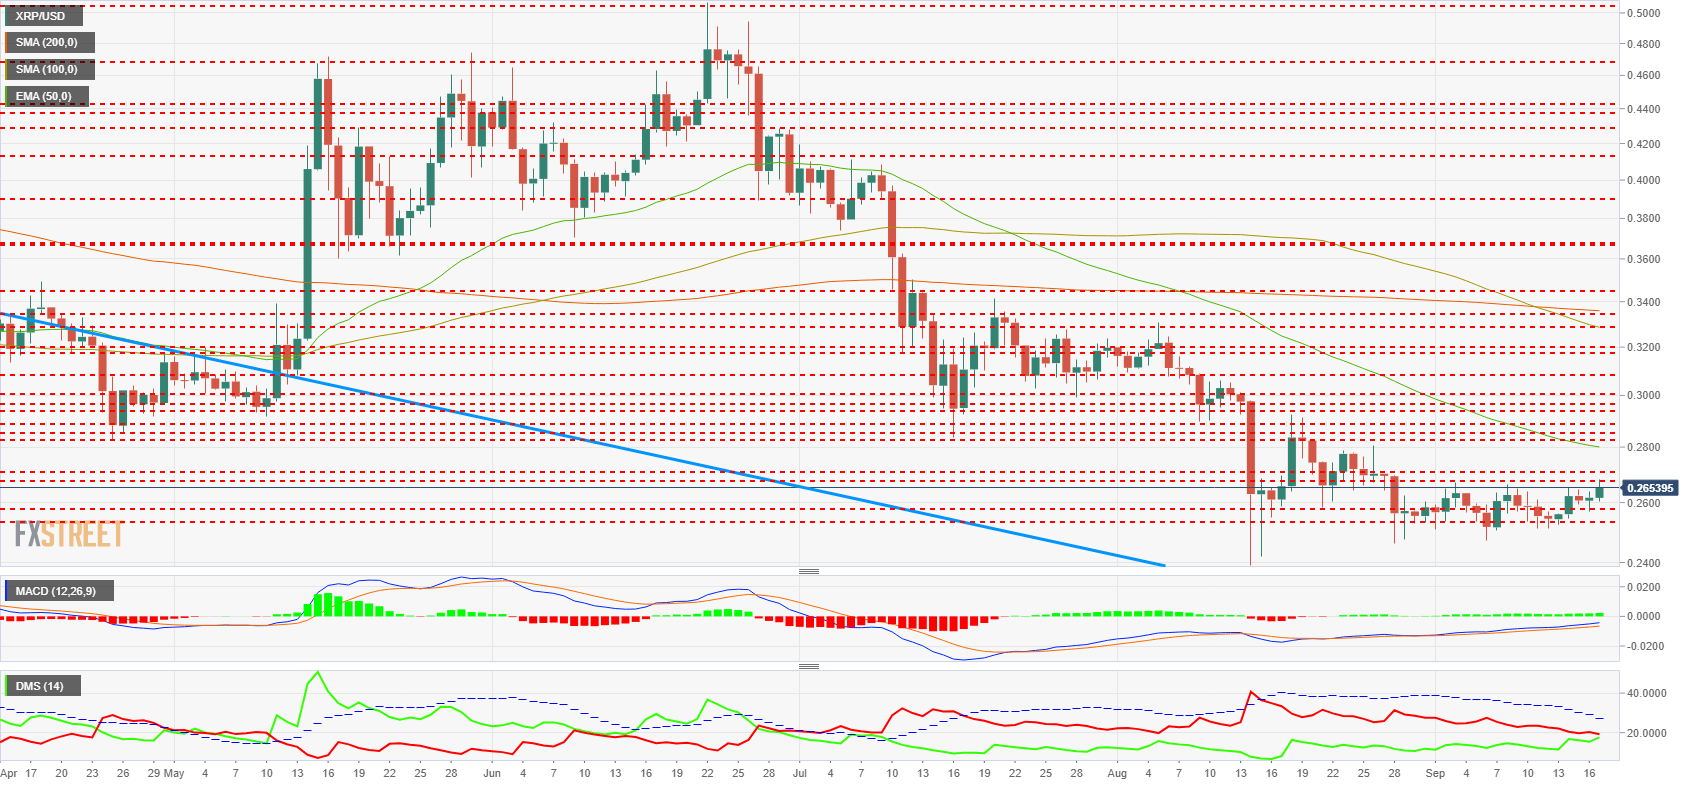
The MACD on the daily chart improves substantially from yesterday. The bullish slope is increasing, and the opening between the lines is also growing. It is a positive setup but an insufficient improvement for the time being.
The DMI on the daily chart clearly shows the situation. Bulls are trying to take leadership that they haven’t had since late June. The bears continue to lose strength but remain slightly above the 20 levels.
Get 24/7 Crypto updates in our social media channels: Give us a follow at @FXSCrypto and our FXStreet Crypto Trading Telegram channel
