- The ETH/BTC pair has options to give the market a positive surprise.
- Bitcoin is in an area full of obstacles.
- XRP continues in a dead zone with no signs of improvement.
If on Friday the analysis indicated that Bitcoin could go up without the company of the Altcoins, the weekend has given us surprises.
Unexpected technical moves are usually the right ones. It is a market maxim to play the unforeseen, and the upward movement of the ETH/BTC pair is one of these cases.
The improvement in Altcoins has occurred mainly against Bitcoin, without the overall value of the portfolios have improved substantially.
This correlation between Altcoins and Bitcoin is one of the most profound debates currently taking place between technical analysts covering the Crypto market. Long-term charts indicate that, so far, every bullish market segment has paralleled a better performance of the Altcoin segment than Bitcoin.
Many analysts defend that this bullish pattern, reliable until today, has stopped working.
ETH/BTC Daily Chart
The ETH/BTC is currently trading at the price level of 0.01765. It improves from lows at 0.0161 and recovers the support level at 0.017.
Above the current price, the first resistance level is at 0.019, then the second at 0.0195 and the third one at 0.0229.
Below the current price, the first support level is at 0.017, then the second at 0.0156 and the third one at 0.0132.
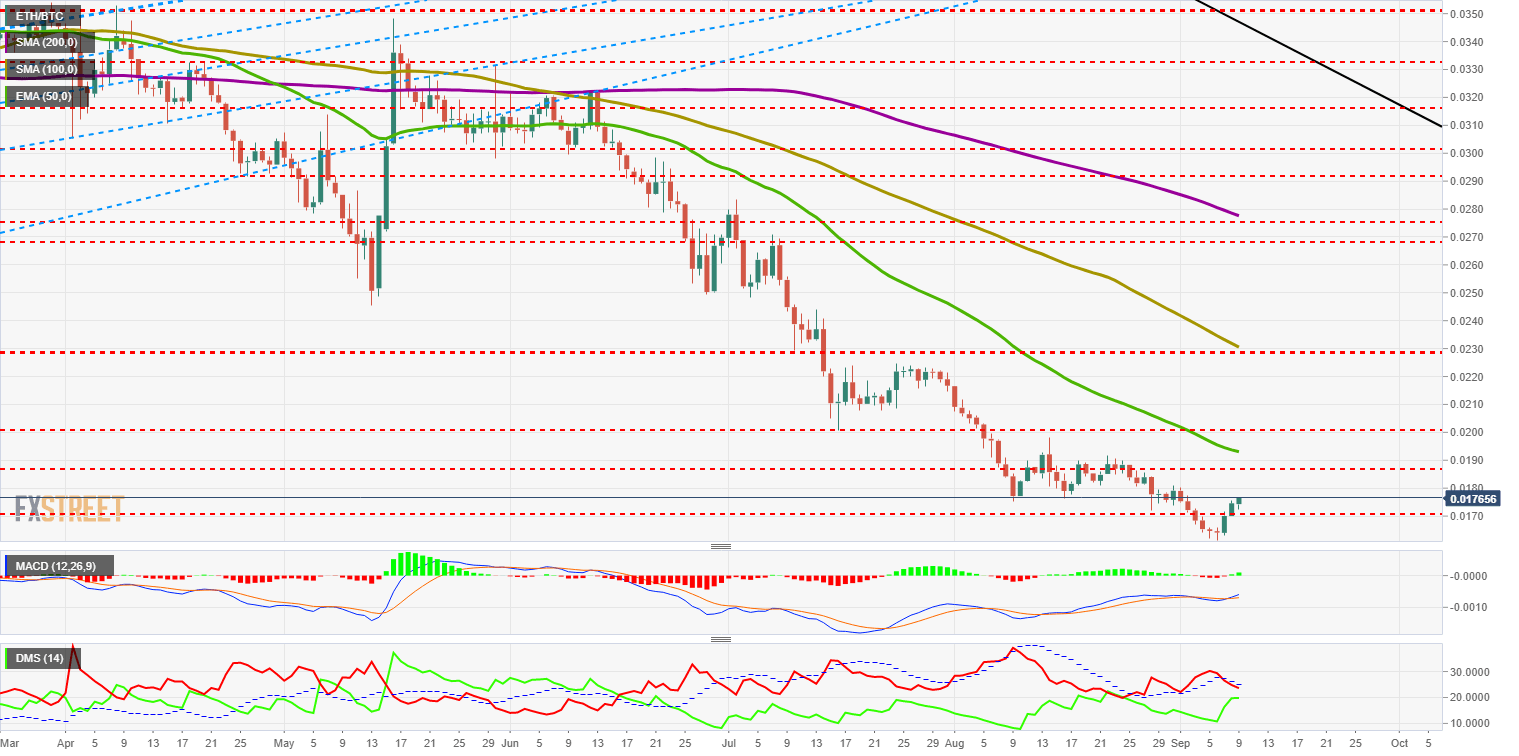
The MACD brings us good news and crosses the bullish trend with strength. It continues to draw a substantial divergence between the price and the indicator, which does not indicate future rises, but if there is a change in trend can be important and lasting.
The DMI on the daily chart takes a radical turn and puts the bears below the ADX line. This cross activates a pattern of changing market forces. The bulls react with violence to the rise, but fail to conquer the level 20 of the indicator and still can not be considered in trend.
BTC/USD Daily Chart
The BTC/USD pair is currently trading at the $10.255 price level and moves compressed from below by the EMA50 and the SMA100 at $10.250. Above this is a price congestion resistance of $10.650, which hampers the bullish move.
Today it seems that Bitcoin is weak and can test the strength of the supports. The 200-period simple moving average reaches at this time the upper level of the long-term bearish channel that ruled the 2018 bear market. This data provides solidity for the long term.
Above the current price, the first resistance level is at $10,650, then the second at $11,270 and the third one at $12,000.
Below the current price, the first support level is at $10,250, then the second at $9,550 and the third one at $9,150.
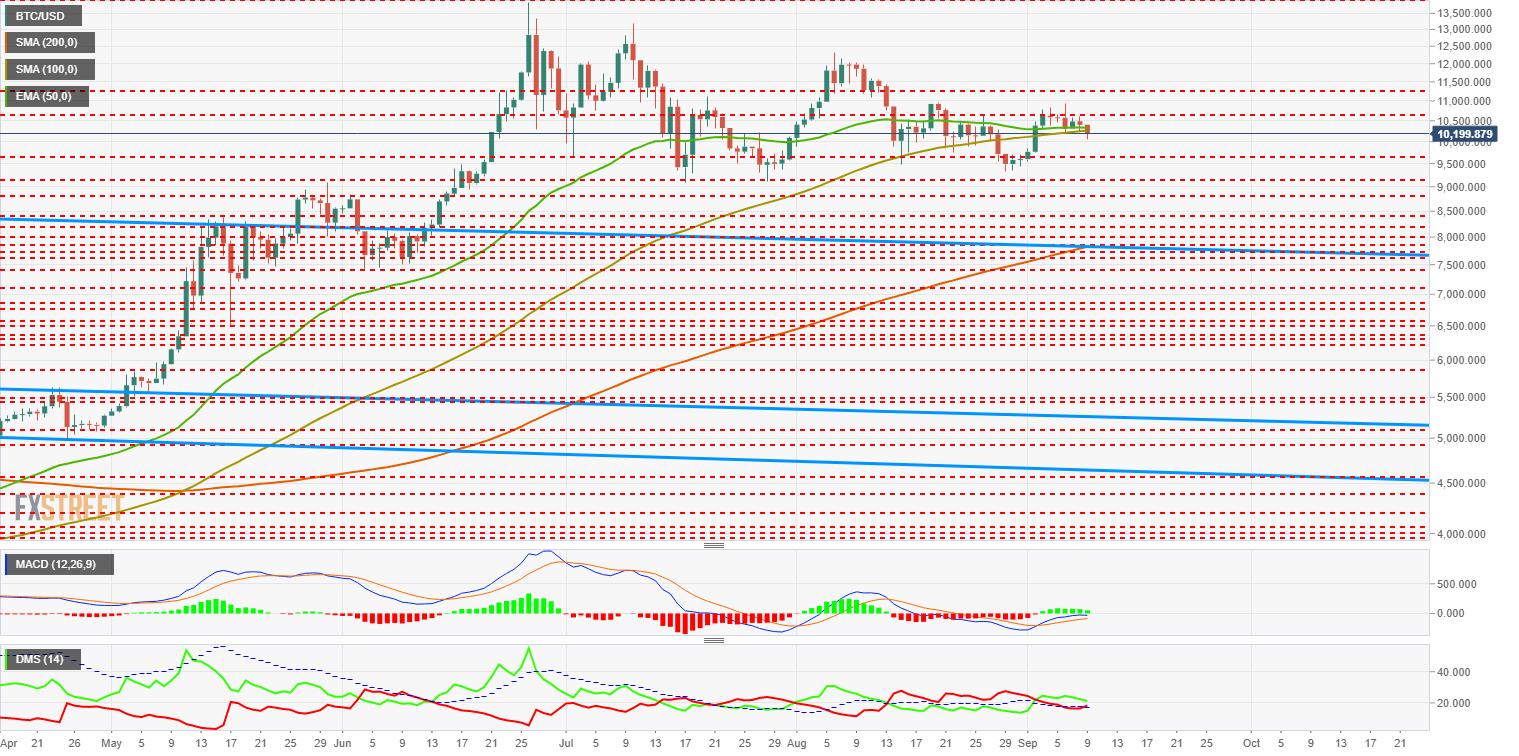
The MACD on the daily chart loses strength as it reaches the neutral indicator level, losing both inclination and openness between the lines. The typical pattern is quite open and can develop towards both sides of the market, although with a higher chance of continuing with weakness rather than seeing a continuation of bullishness.
The DMI on the daily chart does provide us with information on a possible price direction. The bears lose the support of the ADX line and activate a bearish pattern, while the bulls make the reverse move, are placed above the ADX line and improve a lot for the short term.
ETH/USD Daily Chart
The ETH/USD is currently trading at the $178 price level, losing $180 yesterday. Support at $170 looks reliable. The Ethereum draws a precise double bottom figure at this level.
Above the current price, the first resistance level is at $190, then the second at $195, and the third one at $200. At this third resistance level come together two moving averages and a congestion resistance price, marking this level as key.
Below the current price, the first support level at $170. Because of the reliability showed and the double bottom figure, the level becomes key. The second support level is at $162 and the third one at $155.
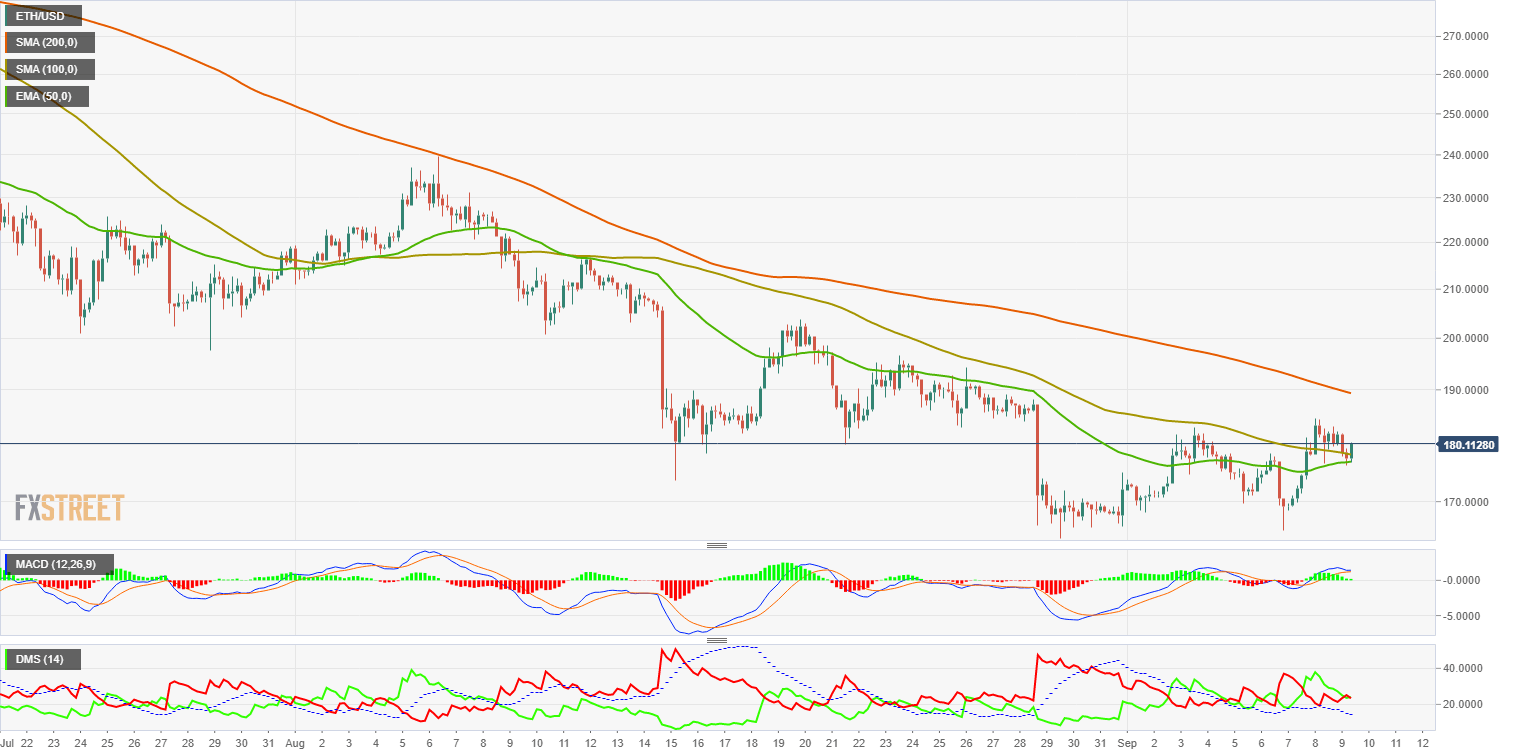
The MACD on the daily chart gains some uptrend and openness between the lines. The improvement in the structure of the indicator is insufficient to be able to bet on bullish continuity.
The DMI also does not propose an improvement for the Ethereum price against the US dollar. The bears continue with their soft downward trend, while the bulls improve a little but are still far from being able to dispute the leadership on the selling side.
XRP/USD Daily Chart
The XRP/USD is currently trading at $0.2603 and continues to show weakness and lack of a worrying trend. The overall technical structure lacks bullish signals, with only the current bearish sideways trend showing some conviction in the short term.
Above the current price, the first resistance level is at $0.267, then the second at $0.271 and the third one at $0.283.
Below the current price, the first support level is at $0.257, then the second at $0.253 and the third one at $0.238.
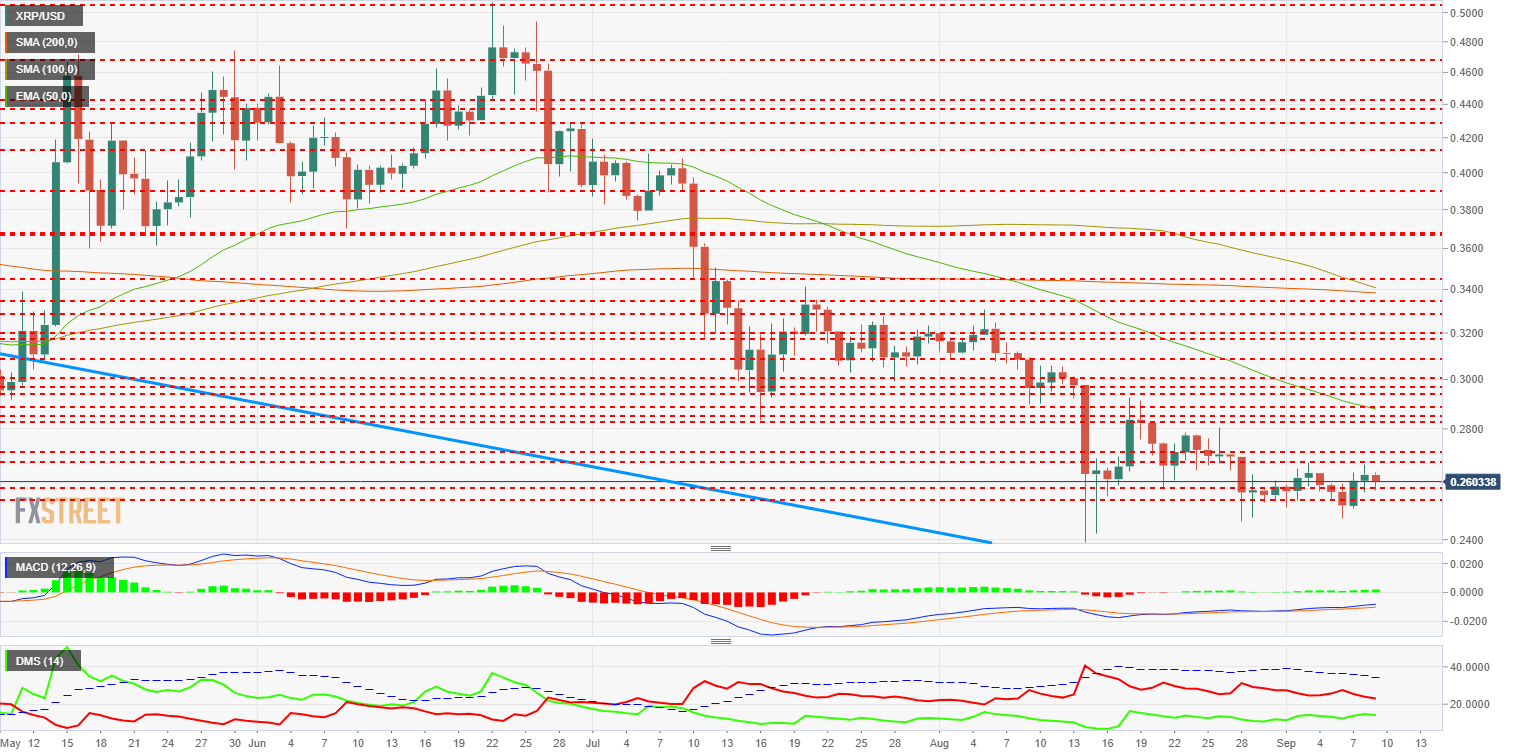
The MACD on the daily chart continues to show a divergent price structure. Moving averages are slightly inclined to the upside, with a tiny opening between them. The current structure does not provide visibility for short to medium term.
The DMI on the daily chart shows the bears are holding the level of the last few weeks. The bulls have improved in the previous few days and are approaching the selling side of the market. Despite the improvement, the buyer side is far from snatching control from the seller side.
Get 24/7 Crypto updates in our social media channels: Give us a follow at @FXSCrypto and our FXStreet Crypto Trading Telegram channel
