- Ethereum offers a unique opportunity to increase its value in Bitcoin terms.
- A surprising rise in BTC/USD but no short-term effect.
- A whale gets a 300,000 ETH loot.
The trading week comes to an end with attention focused on two reasonably significant market data.
First, the strong bullish move yesterday by Bitcoin, which gained more than $1,000 in 60 minutes. The movement has placed the BTC/USD pair above all major moving averages and opens the door to further rises in the absence of relevant resistance.
The second piece of news is the purchase in a single order of 20,000 Ethereums, which would complete a total investment of 300,000 ETH so far this month for a total value of $70 M.
The total amount of the purchase is almost as significant as the moment in which it happens. The Ethereum is at one of the lowest levels in history against the Bitcoin.
Buying Ethereum is one of the best options today to take positions in Bitcoin. The current value is very deviated from historical averages. Likely, the price ratio between the two will at least double in a very conservative technical projection.
Translated into money, a person who wants to buy 0.1 BTC directly should put on the table about $1,050. The option to enter using the Ethereum is to purchase approximately 5 Ethereums for that amount and get 0.2 Bitcoins in the future while taking advantage of the increased value of Ethereum in the market.
The operation carries its risks, but it’s lower than entering directly via Bitcoins using the stops appropriately as I explain in the technical section of the ETH/BTC pair.
Perhaps that is the intention of the strong purchases of some individuals in the Ethereum.
ETH/BTC Daily Chart
The ETH/BTC pair is currently trading at the price level of 0.0211 after failing to form the “dawn star” figure on Wednesday. The figure remained incomplete, which usually results in a scenario in which the upswing process lengthens over time.
Above the current price, the first resistance level is at 0.0229 (price congestion resistance), then the second at 0.025 (price congestion resistance) and the third one at 0.0268 (EMA50 and price congestion resistance).
Below the current price, the situation is complicated because there are only two precise support levels. The first is at 0.020 and the second at 0.0155, both price congestion supports. These are the mandatory stop levels for those whose goal is to accumulate Bitcoins. If it is an investment not aimed at that specific objective of accumulating BTC, you should look at the chart of the ETH/USD pair and make decisions based on it.
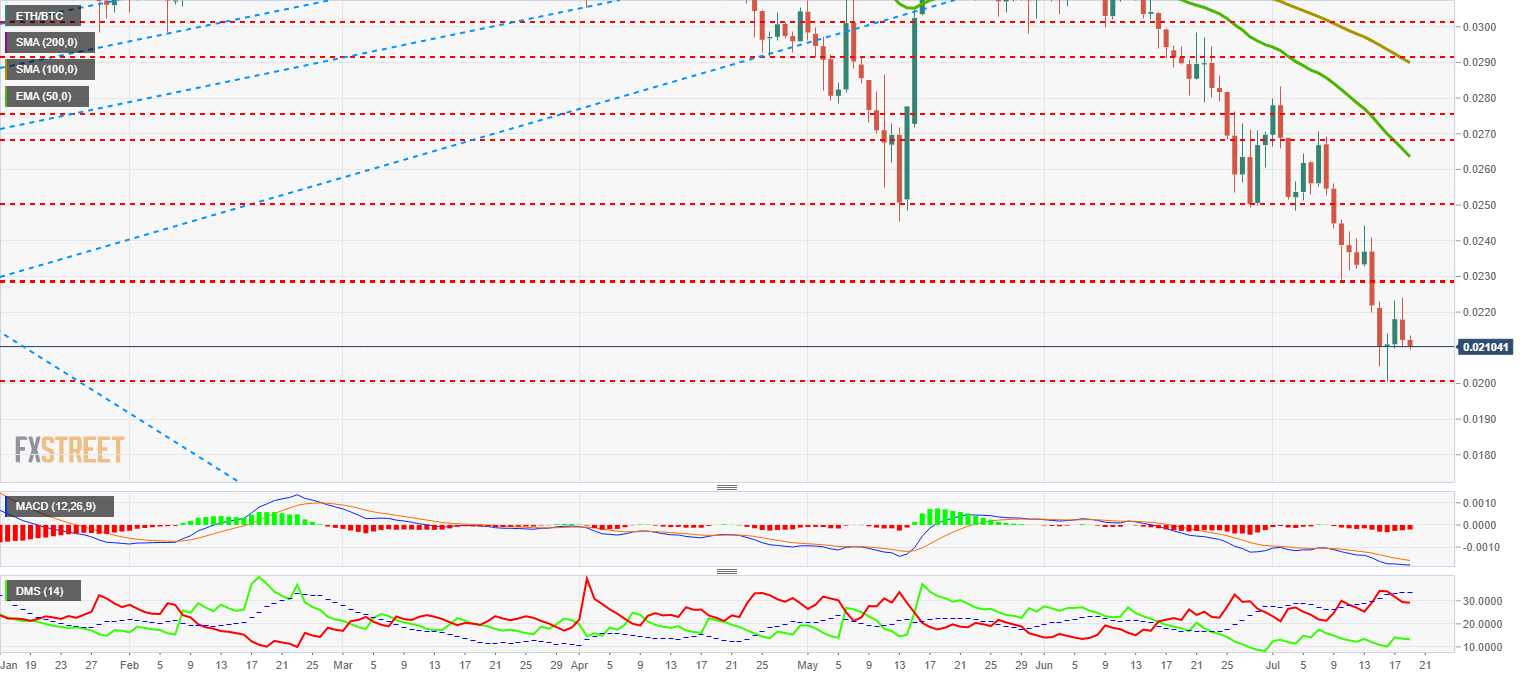
The MACD on the daily chart prolongs the agony while retaining the profile where the highest probabilities fall on the bullish side in the short term. The question is whether this cross will bear fruit in the medium and long term.
The DMI on the daily chart shows how the bears are reluctant to relinquish control and increase their advantage over the buyer side of the market. The bulls reacted higher on Wednesday but the failure to complete the bullish turn figure seems to have negatively impacted this side of the market.
BTC/USD Daily Chart
The BTC/USD is currently trading at $10,330 and is regaining support for the EMA50. Yesterday it rose by $1,000 in just one hour and showed a market still in a FOMO mode.
Despite conquering the exponential average, it failed to overcome the price congestion resistance at $10.575. The second resistance level is at $11,300 and the third one at $14,000 (price congestion resistance and relative highs).
Below the current price, the first level of support is at $10,000 (EMA50), then the second at $9,700 (price congestion support) and the third one at $9,150 (price congestion support).
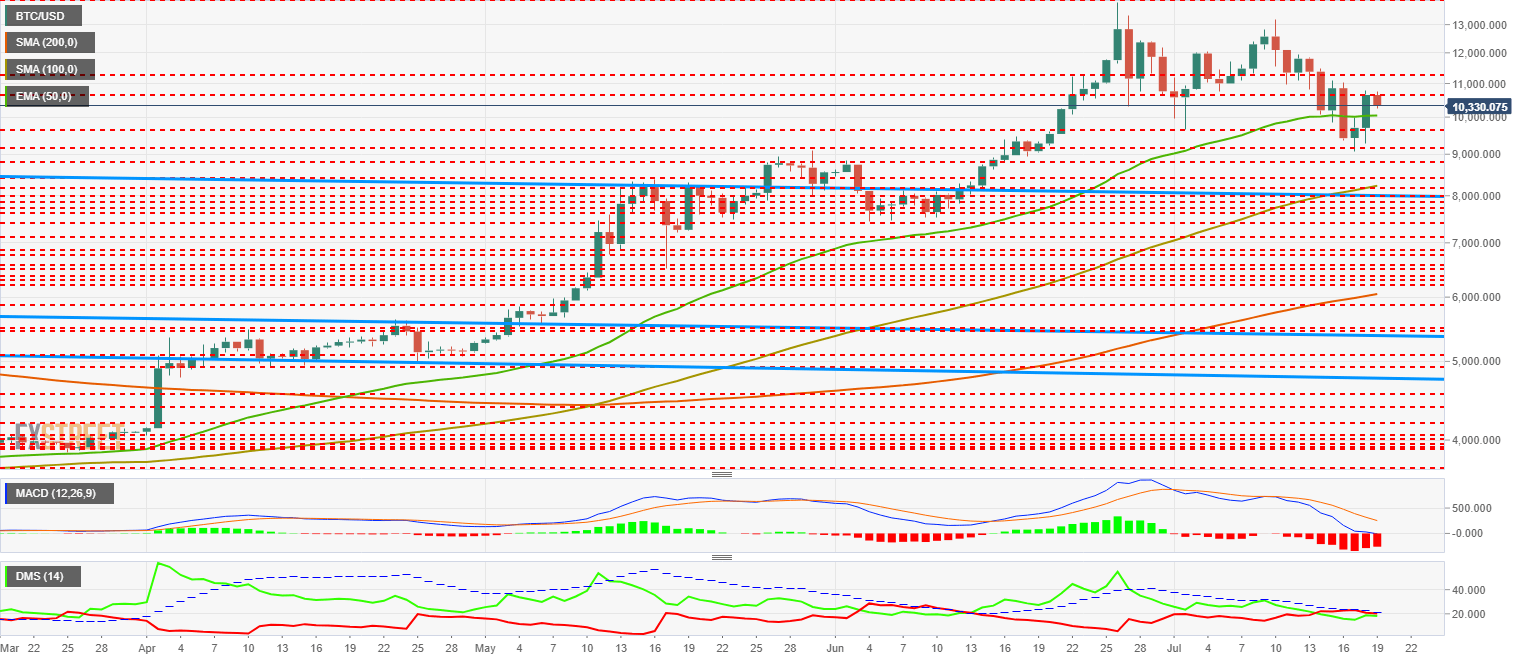
The MACD on the daily chart shows how the fast average reaches the 0 levels of the indicator, a promising point for an attempt to stop the fall. The separation between lines is significant, which complicates this scenario and favors bearish continuity.
The DMI on the daily chart shows how the forces have equalized thanks to yesterday’s sudden rise. Both sides of the market are slightly below the ADX line.
ETH/USD Daily Chart
The ETH/USD is currently trading at the $217 level. After yesterday’s move, the Ethereum recovered to the $220 support level but failed to regain support for the SMA100.
Above the current price, the first resistance level is at $238 (SMA100 and price congestion resistance), then the second at $250 (price congestion resistance) and the third one at $260 (EMA50 and price congestion resistance).
Below the current price, the first level of support is at $220 (price congestion support), then the second at $215 (price congestion support) and the third one at $207 (price congestion support).
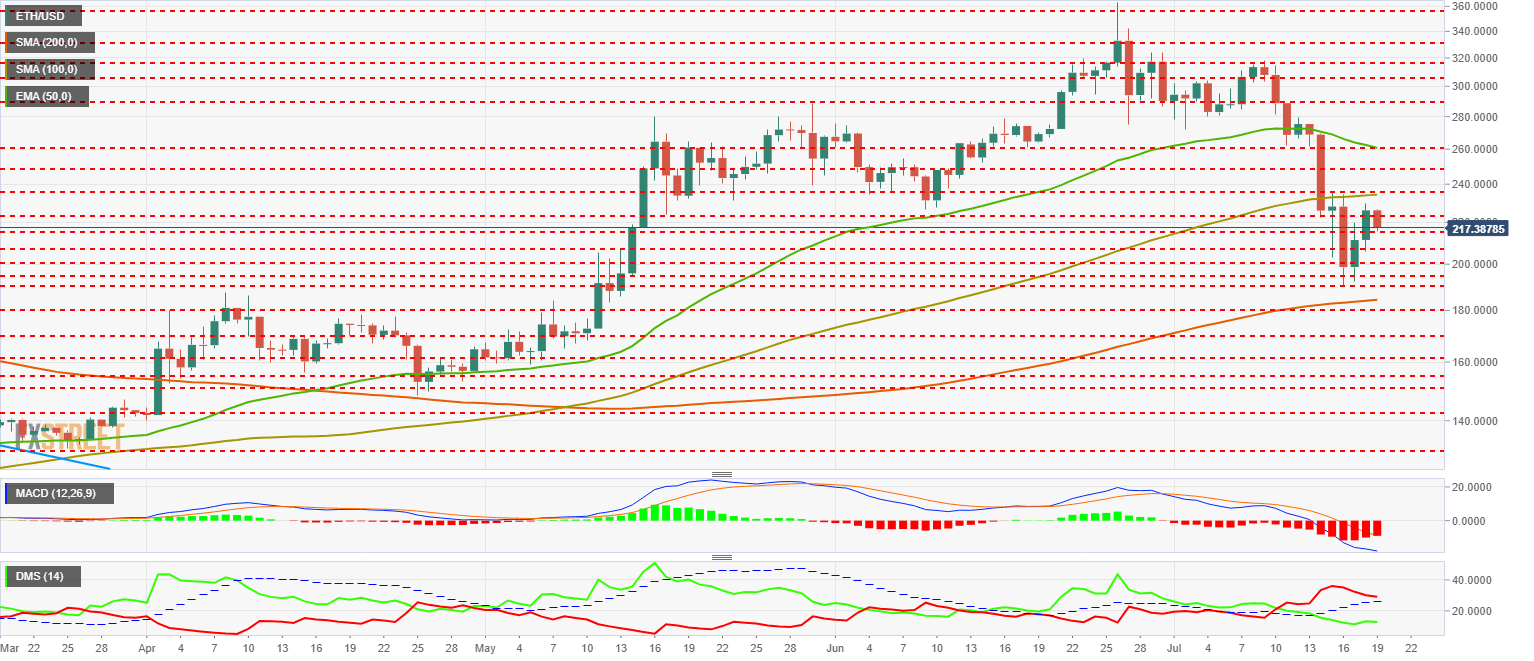
The MACD on the daily chart shows a decelerating structure of the bearish movement. The amplitude between the lines indicates that the healing process can extend over time.
The DMI on the daily chart confirms the MACD scenario. The bears control the pair and move well away from the bulls. They are also above the ADX line, which validates the existence of an ongoing bearish trend.
XRP/USD Daily Chart
The XRP/USD is currently trading at the $0.317 price level and it is recovering strongly from the weekly lows of $0.28.
Above the current price, the first resistance level is at $0.329 (price congestion resistance), then the second at $0.334 (price congestion resistance) and the third one at $0.345 (SMA200 and price congestion resistance).
Below the current price, the first level of support is $0.316 (price congestion support), then the second at $0.309 (price congestion support) and the third one at $0.30 (price congestion support).
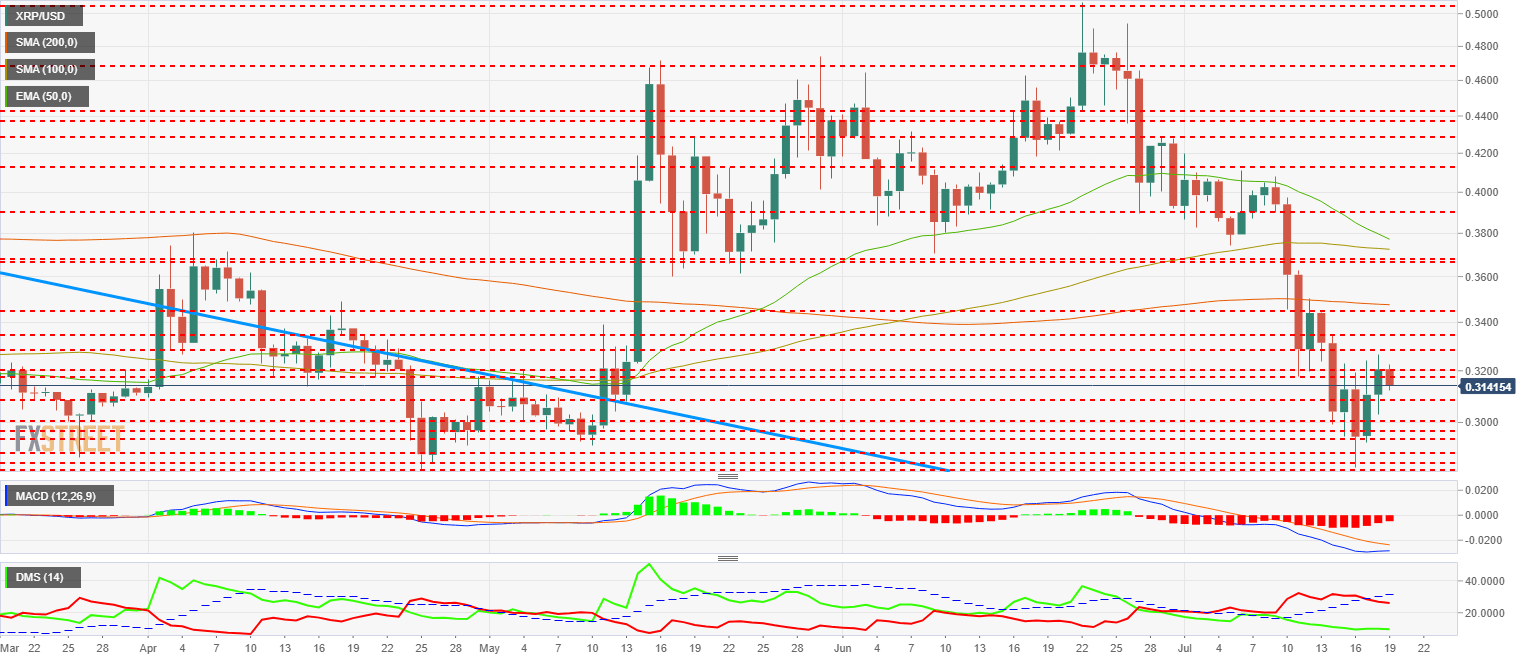
The MACD on the daily chart shows a profile very close to a bullish cross attempt. This type of cross usually fails at the first attempt and causes increased volatility.
The DMI on the daily chart shows bears crossing down the ADX line. This bullish data fades by the lack of reaction of the bulls.
Get 24/7 Crypto updates in our social media channels: Give us a follow at @FXSCrypto and our FXStreet Crypto Trading Telegram channel
