- The current selloff can be stretched by days or even weeks.
- Bitcoin takes the worst part and enters a long-term bearish scenario again.
- Falling-knife hunters must be careful not to lose their fingers.
I’ve spent the last four days disconnected from technical analysis and back to work the scene is bleak.
Last week I already warned that the crypto market was in a situation of extreme fragility and hours turned the warning into reality.
The three active industry leaders, Bitcoin, Ethereum and XRP, visited price levels that were already part of a bearish scenario that has to be canceled.
The current scenario indicates a high probability of visiting structural support levels that will squeeze the emotional resilience of less-experienced traders.
The current bearish setup may drag on for several days and the “market panic” is not yet in the headlines.
ETH/BTC Daily Chart
After three failed attempts to surpass the 0.22 level, it is time to test supports and ETH/BTC has gone up to the SMA200. The 0.22 level will be useful to check the health of the crypto pair.
Below the current price, the first support level is at 0.020, then the second at 0.019 and the third one at 0.018.
Above the current price, the first resistance level is at 0.0209, then the second at 0.022 and the third one at 0.023.
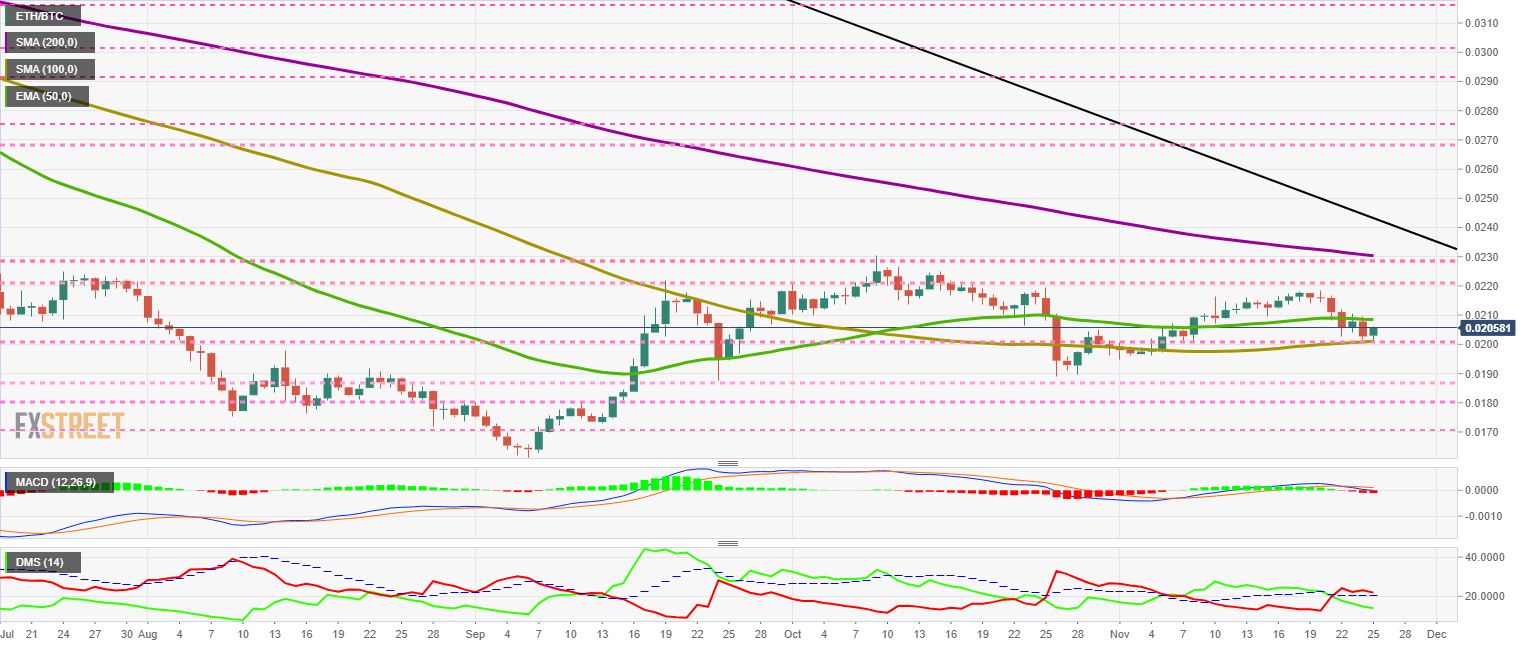
The MACD on the daily chart remains on the bullish side of the indicator. After six days of the bearish market, the profile is slightly bearish and with a tiny opening between the lines. If the technical situation does not worsen suddenly, the upside may come back soon.
The DMI on the daily chart shows bears just above the ADX line without separating, a sign of weakness. The bulls are not at their best either and persist in the downtrend.
BTC/USD Daily Chart
The BTC/USD pair is currently trading at the $6.849 price level and is recovering after leaving the day’s low at the $6.500 support level.
The scenario changed dramatically in just four days, and right now, it is more likely that there will be a visit to $5,000 than knocking on the door of the $10,000 mark. In order to cancel this grim scenario should be necessary a consistent close above $7,500.
The technical pattern of classic moving averages and technical indicators suggests that the current scenario is going to be active for quite some time.
It seems increasingly difficult for Christmas to bring new historical highs for King Bitcoin.
Below the current price, the first support level is at $6,660, then the second at $6,500 and the third one at $6,250.
Above the current price, the first resistance level is at $6,850, then the second at $7,100 and the third one at $7,400.
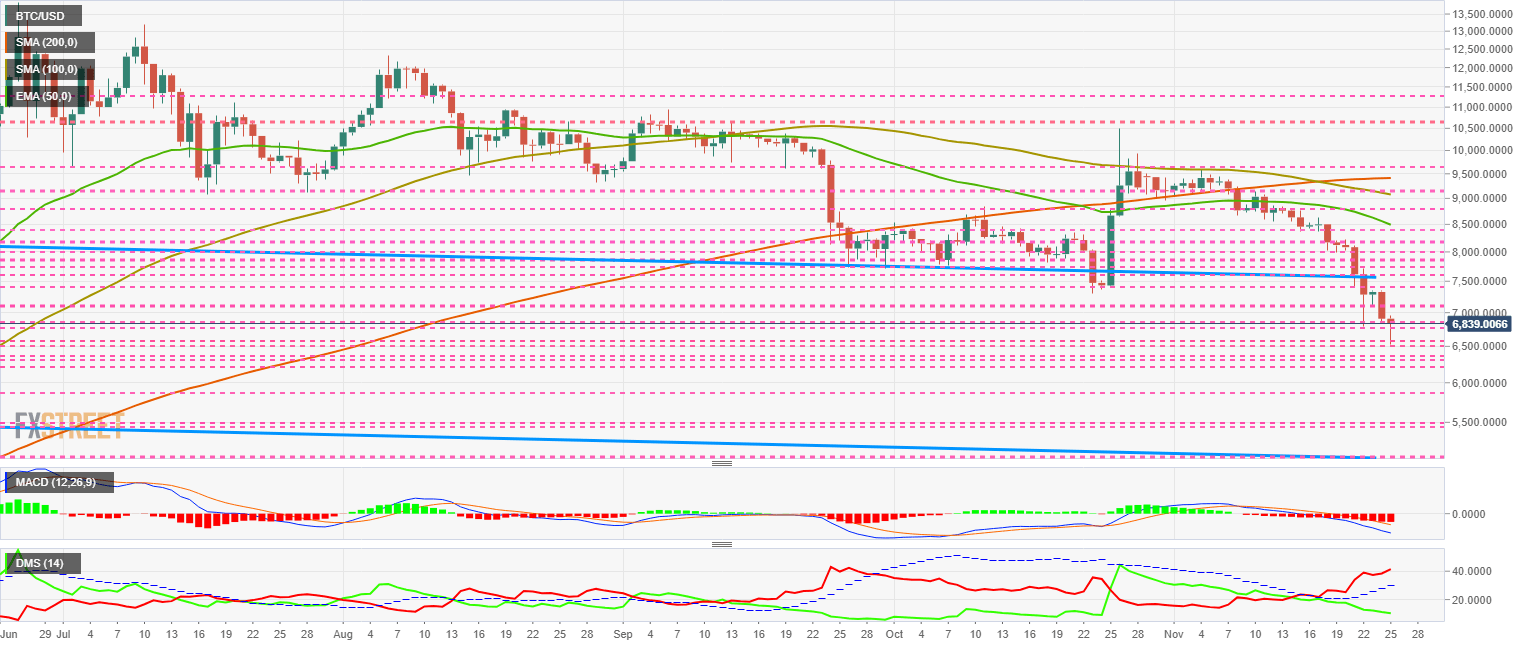
The MACD on the daily chart shows an increase in bearish slope and line spacing. There is no data to suggest a possible price recovery in the short term.
The DMI on the daily chart shows bears solidly dominating the BTC/USD pair, while bulls extreme losses and distance themselves from any attempt to regain control in the Bitcoin.
ETH/USD Daily Chart
The ETH/USD pair is currently trading at the $142 price level after leaving the day’s low of $132.
Below the current price, the first support level is at $130, then the second at $125 and the third one at $120.
Above the current price, the first resistance level is at $140, then the second at $150 and the third one at $155.
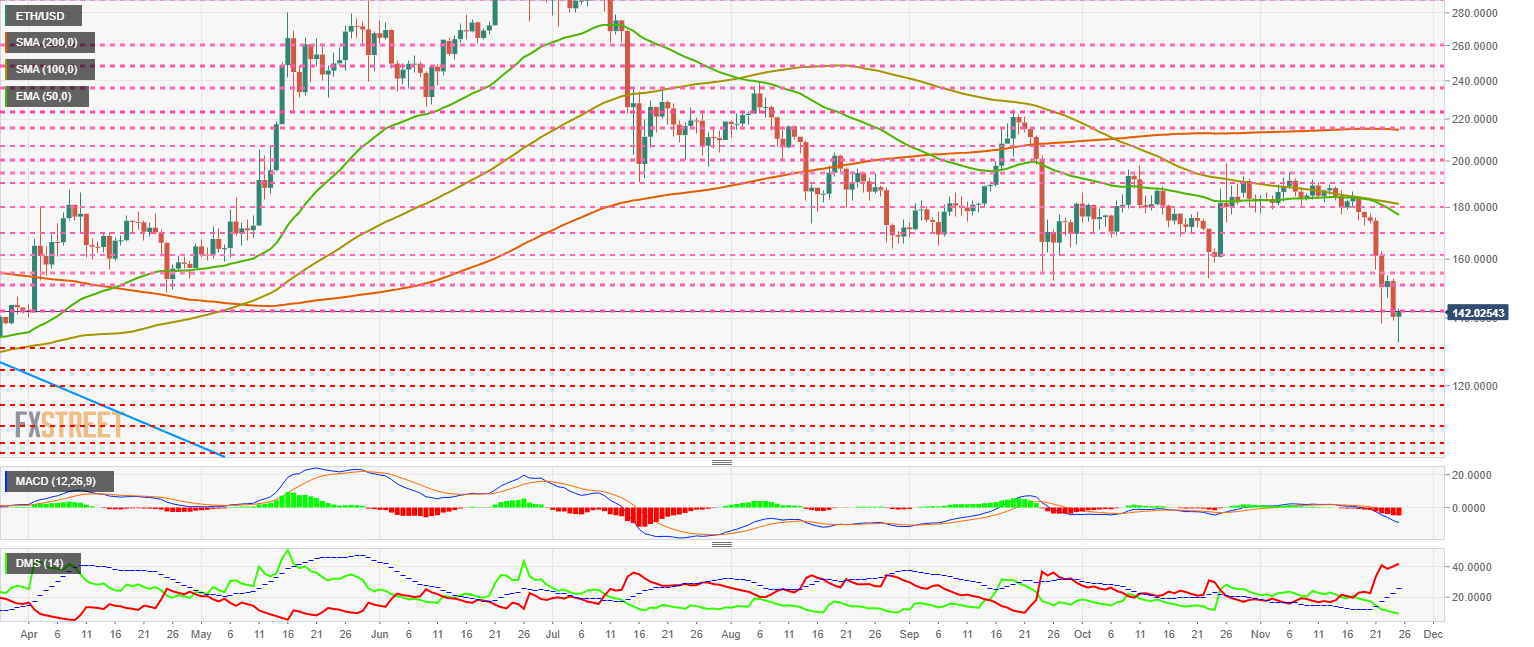
The MACD on the daily chart shows an increase in bearish strength, a situation that looks set to persist for a few more days or weeks.
The DMI on the daily chart shows bears rampant on the upside and at strength levels not seen since December 2018, weeks before the end of that year’s big bear market.
XRP/USD Daily Chart
The XRP/USD is currently trading at the $0.216 price level after dropping the day’s low to $0.201.
Below the current price, the first support level is at $0.20, then the second at $0.19 and the third one at $0.17.
Above the current price, the first resistance level is at $0.22, then the second at $0.24 and the third one at $0.253.
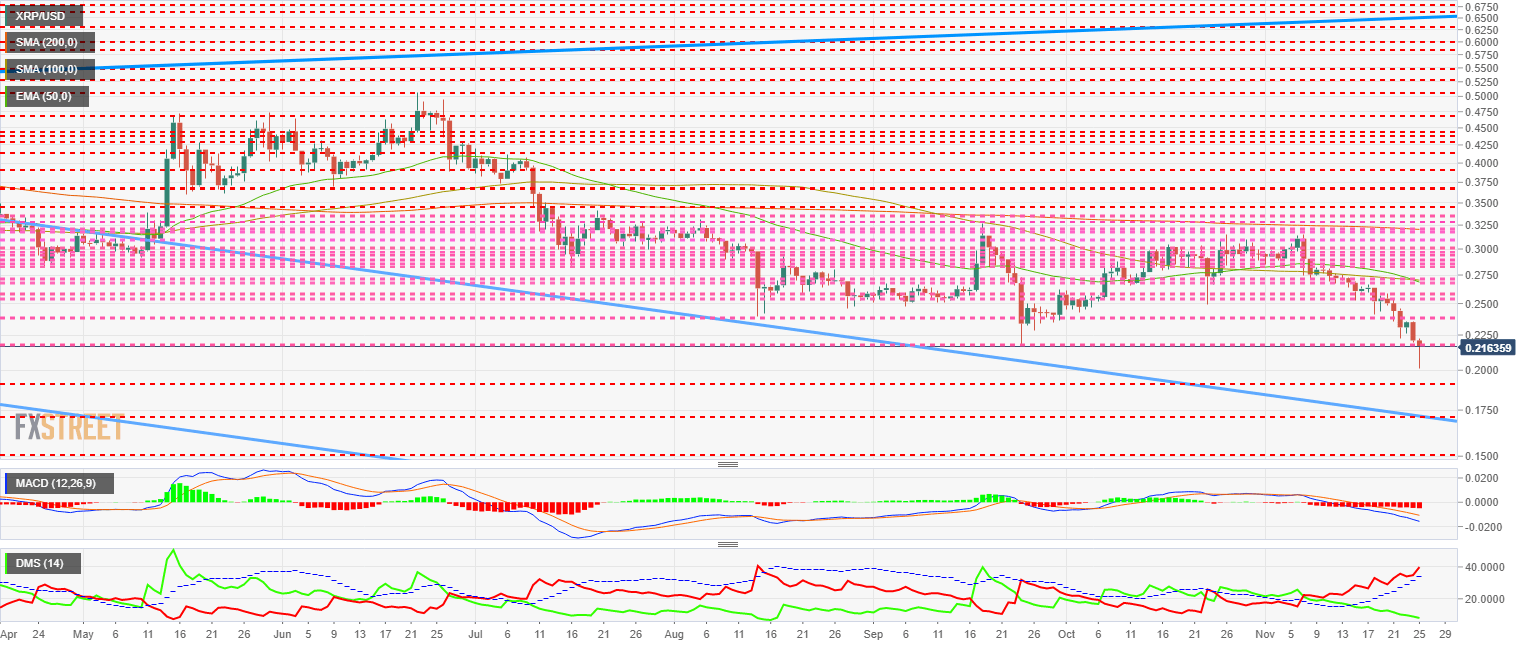
The MACD on the daily chart shows an increase in the downtrend. The bearish potential remains intact, and only a substantial inflow of money could reverse the current pessimism.
The DMI on the daily chart shows both sides of the market at extreme levels. Both bears and bulls move in opposite directions and are so much separated that a technical rebound is very likely.
Get 24/7 Crypto updates in our social media channels: Give us a follow at @FXSCrypto and our FXStreet Crypto Trading Telegram channel
